|
Brainy's
Share Market Toolbox |
You
are here: Share Market
Toolbox
> ASX Investor Update
> ASX
Investor Update December 2012 - more Info
Related links: Summary list of other ASX articles; about Share Market; Robert's Philosophy; Share Market GEMs; Share-Market-Ready;Funda-Technical Analysis; Sensible Investing; Contrarian Investing Redefined; |
|||||||||||||
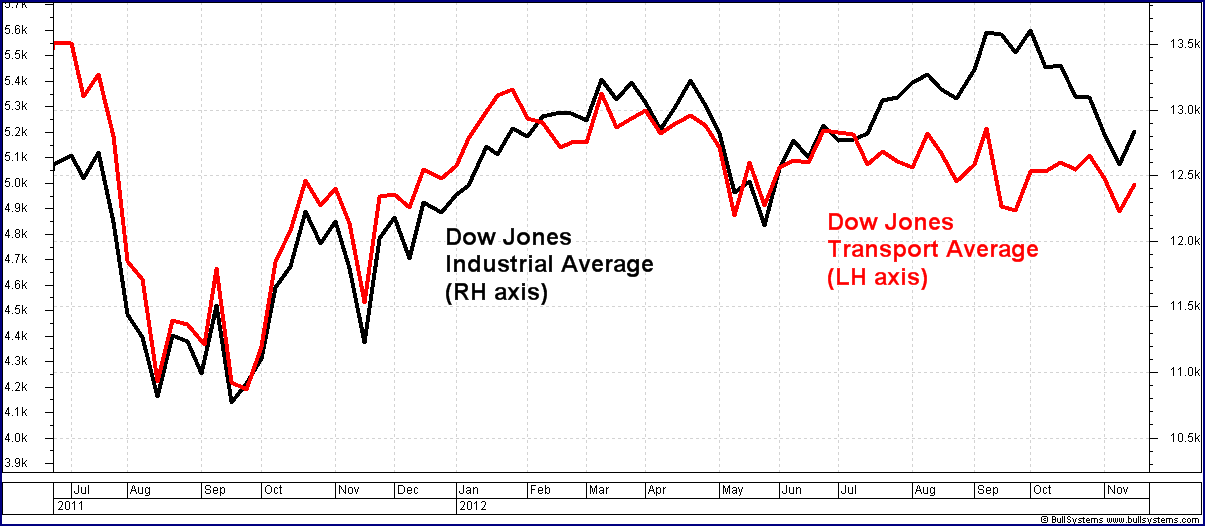
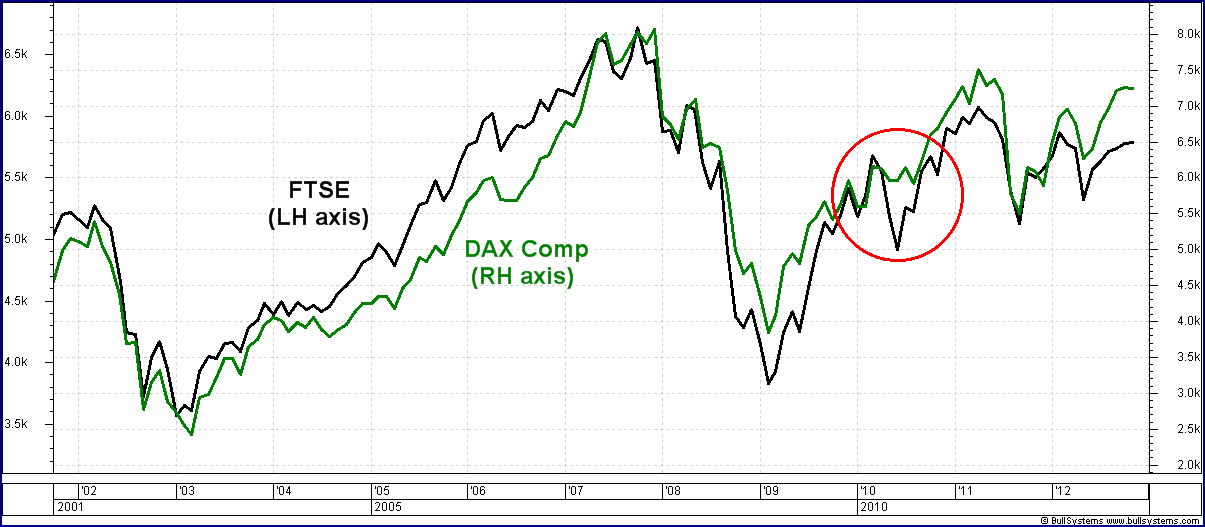
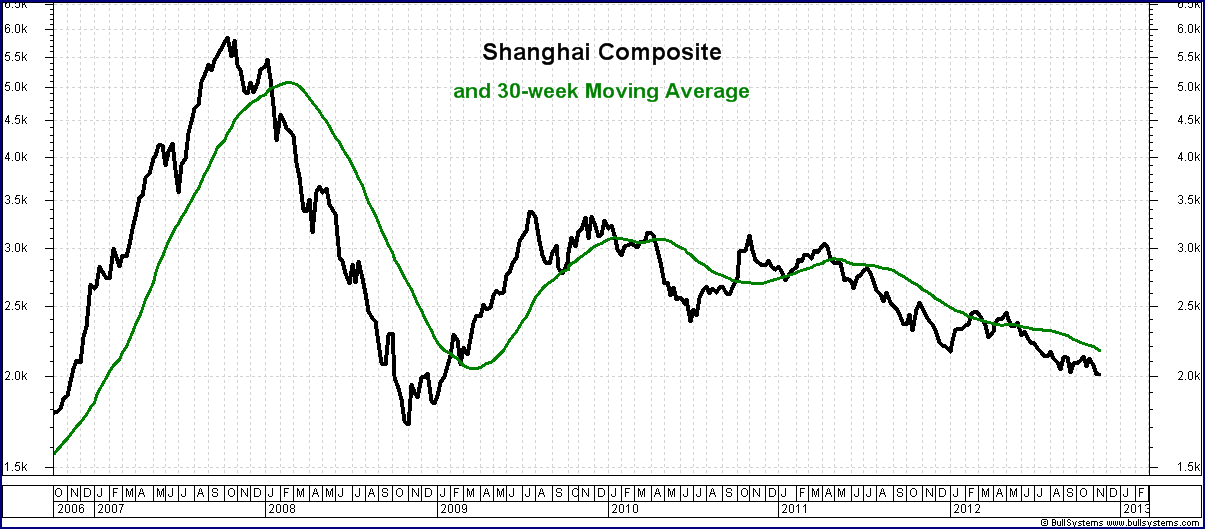
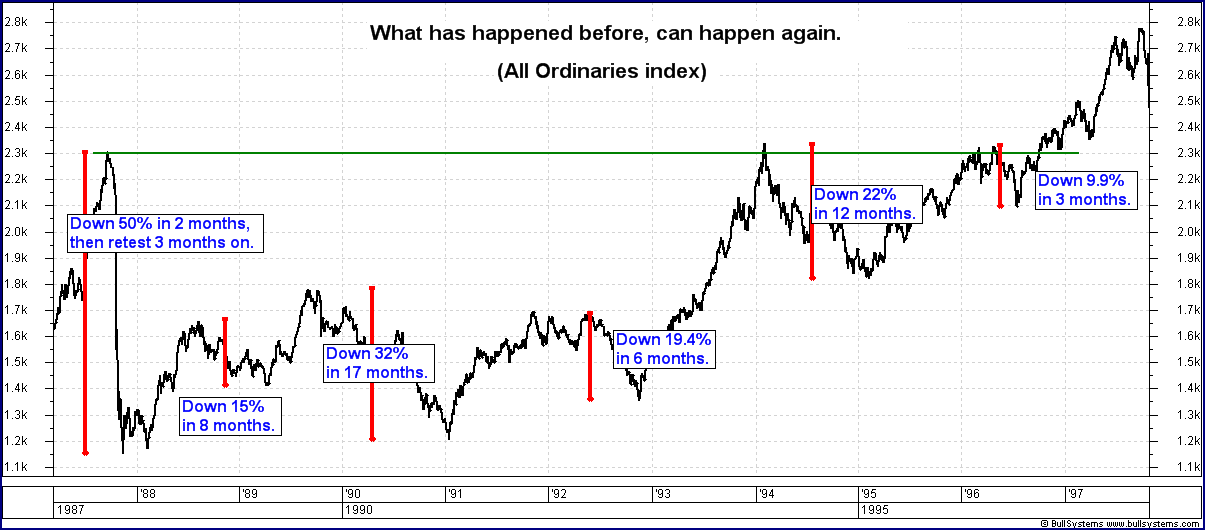
The December 2012 ASX Investor Update newsletterFor the text of the December 2012 article that Robert authored, and the initial price charts, see the ASX article.Below are larger versions of the charts (click on the image for a larger version). American marketsFor the supporting text, refer to the published article.Comparing
the Dow Jones
Industrial Average (DJIA) index
to the Dow Jones Transport Average (DJTA) -- short term (click on the chart for a larger image) European marketsFor the supporting text, refer to the published article.ChinaFor the supporting text, refer to the published article.Australia's outlook?For the supporting text, refer to the published article.More Information?Want to understand more about how to interpret the price charts? See the details above... |
To
print this web page - in your browser select the printing
option "Shrink to fit". View larger versions of the charts below by clicking on the chart. More informationTo understand more about how to interpret the underlying mood and sentiment using the price charts:
Share
Market Terminology
See Brainy's eBook Articles, and the Master Index list for details. Or, search the eBook Articles. Robert Brain provides support to both new and experienced traders and investors. Who
is Robert Brain? 
The toolbox is an arsenal of weapons to help you tackle the share market. See a list of contents on the Toolbox Gateway page. The Share Market - more information about the market and investing and trading.  And whatever you do,
beware of the sharks in the ocean! |
||||||||||||
|
The information presented herein
represents the
opinions of the web page content owner, and ©
Copyright 2012-2015, R.B.Brain -
Consulting (ABN: 52 791 744 975).
|
|||||||||||||


