|
Dear Reader,
This month's eBook
Articles email contains some extremely useful information to help us
understand the underlying mood in the market. So it is going to all
Toolbox Members, and to the people who have registered to receive
occasional information about the Share Market. (Any non-member who no
longer wants to receive this material can simply unsubscribe using the
SafeUnsubscribe link at the bottom - or just Update Your Profile to
change your interests.)
Two months ago I explained that share price charts hide a wealth of information about the mood and sentiment of the market, with 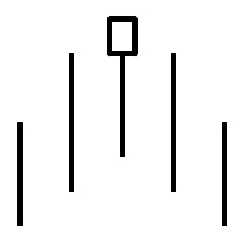 clues about likely future share price movement - in the chart patterns in particular (eg. triangles, etc.). And last month
I continued that theme and explained how even more information is
available in the candlesticks - both the features of individual
candles, and also in the patterns of multiple candles (like the Hanging Man pattern shown at right). And last month I had some new Member-only web pages to support this material (links are in the July eNews email, or follow the links from this updated candlestick public page). clues about likely future share price movement - in the chart patterns in particular (eg. triangles, etc.). And last month
I continued that theme and explained how even more information is
available in the candlesticks - both the features of individual
candles, and also in the patterns of multiple candles (like the Hanging Man pattern shown at right). And last month I had some new Member-only web pages to support this material (links are in the July eNews email, or follow the links from this updated candlestick public page).
In preparing the material for my contribution to The Age newspaper a couple of weeks ago (see the published article, or a scanned copy), I decided to post some extra material about market turning points, the Tower Bottom candle pattern and compound candles. You can see that here in the Toolbox.
This prompted me to update two existing eBook Articles about
candlesticks, and to write two new ones. There are now four eBook
Articles in the Toolbox that cover the subject of candlesticks and
candle patterns.
More details below.
Over the next few months, the topics of focus in this monthly eNews email will include:
- Money and Risk Management, including position size (ie. how to minimise losses and maximise profits).
- Liquidity - how to avoid thinly traded stocks.
Please read on....
|
|
|
Recent focus topics
The monthly focus in the last few months has been:For the benefit of all the new readers this month,
useful information in the last few month's emails is
available in the email archive (no password needed). |
|
This month's focus:
Candlestick interpretation
and candle addition
 | | Candle addition |
In
last month's focus we looked at candlestick charts and patterns. To
support that material we had some new web pages in the Share Market
Toolbox for members (web links to these pages are in the next section
below).
Last month's material is extended this month with one new eBook Article
which supports the new web pages from last month, and includes three
A4-size candle pattern posters.
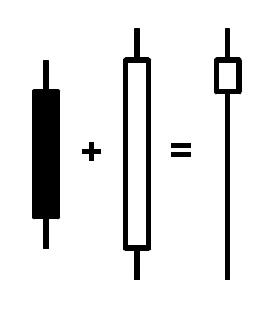
And there is another new Article on Composite Candles and Candle Addition.
This describes a topic that is rarely talked about - the notion of
"adding together" two or more candles to produce just one candle. This
is depicted in the accompanying sample graphic, where a black candle
and an engulfing bullish white candle together comprise the Bullish Engulfing
candle pattern. But if we "add" these two candles together, the result
is the third "Compound Candle" shown in the diagram which is actually a
Hammer pattern.
Understanding this idea, and being able to apply it, can make a big
difference to what we can "see" in the candle charts, and our
interpretation of the underlying market mood and sentiment. See the
Candlestick eBook Articles listed below for more details, and
especially Article TA-3780, "Composite candles...".
|
|
Toolbox web pages with Candle details
[ This section is repeated from last month.] Here is a summary list of useful web pages (most for Toolbox Members, requiring username and password):
|
|
How to spot the candle patterns?
One of the things that puzzled me for a long time when I
started studying candle patterns, was that there is a very long list of
different patterns, and it is so hard to work out which pattern is
which, and what they all mean. [Can you relate to that?] There is a lot
of web-based material available that describes many candle patterns,
but nothing to help explain how to easily identify the various candle
patterns - until now!
So, in addition to my new candlestick material last month, I have written the new eBook Article TA-3710, "Candlestick interpretation". See the link below.
|
|
Candlestick eBook Articles
This month the two existing eBook (PDF) Articles on candles
have been re-written (and re-numbered), and two more Articles have been
added to the collection: - TA-2100 "Price charts and time periods"
(unchanged) provides an introduction to price charts, and describes the
key differences between line charts and candle charts (the free page 1 for non-members is here).
- * TA-3700 "Candlesticks explained" - (the free page 1
for non-members is here). This Article has been renumbered this month,
and updated (please dispose of the earlier version with Article number
TA-3110).
- TA-3710 "Candlestick Interpretation" - (the free page 1
for non-members is here). This brand new 6-page Article supports the
new candlestick web pages that were announced last month. This Article
goes into more detail, and it is easier to print for future reference,
and it includes the three A4-size candle identification posters.
- * TA-3750 "Candlestick patterns" - (the free page 1
for non-members is here). This Article has been renumbered this month,
and updated (please dispose of the earlier version with Article number
TA-3700).
- TA-3780 "Composite candles and candle addition" - (the free page 1
for non-members is here). This 6-page Article is brand new and explains
a topic that is rarely talked about - the usefulness of understanding
that if we look at two candles together as a single "compound candle",
we can often better understand the underlying mood and sentiment of the
market.
* - These two Articles have been renumbered this month.
There are now a total
of 104 Articles in this eBook collection of Articles (435 pages of
information)! You can see the Master List of all Articles here (recently new or updated ones are highlighted), and the Detailed Topic Index here. And don't forget to see the updated Table of Contents pages (see links in side-bar at right).
|
|
eBook (PDF) Articles - Summary
Over the last two years I have accumulated quite a collection of eBook (PDF) Articles
on three subject areas - Share Trading/Investing, Technical Analysis
and BullCharts software (actually more than 400 pages of material
in more than 100 articles). These Articles are invaluable for both new
and experienced investors and traders. I
am now writing brief monthly notes in this eNews email to
highlight specific Articles on targeted topics. I am also writing new
Articles and updating existing ones as required. For more information
about the changes, see the December 2010 eNewsletter email in the eNews email Archive. For more information see: |
|
|
Article front pages
As of early January 2011 with the change in publishing approach for 2011, I significantly revised the Introduction Article and the Overview Article for each of the three subject areas. You can see them here:
- Share Trading / Investing:
|
|
Any problems?
What
if you have some sort of problem with accessing the Toolbox and any of
these Articles? Or maybe the Username and Password doesn't work. If
there is any problem at all, simply contact me by email or phone. The
best email address for this is: support@robertbrain.com.
Occasionally emails disappear - the system thinks they are spam, or the
ISP might think they are spam. If I don't reply within a day or so,
please contact me by other email address or phone. |
|
In Closing
There is nothing secret in this
email, so feel free to forward it to someone if you think they might
benefit from the information, or from being a Toolbox Member. The
easiest way to do this is to use the "Forward Email" link at the bottom.
I
am also confident that my Toolbox Members won't be sharing their
username and password with non-members. It is not fair that I spend all
this time preparing the materials, and then my Toolbox Members pay
money to have legitimate access, only to let some people pay nothing to
read and view the details.
Please
feel free to email an individual Article to others as a sample; but if
they want online access to all the materials, it is pretty cheap, so
they should subscribe as a Toolbox Member. There is information about Toolbox Membership in the Quick Links section at right.
Happy to receive feedback, or suggestions for new content or improvements.
Until next month,
Happy investing or trading,
Robert B. Brain
(mobile: 0438 355 910)
ps: watch out for the sharks in the ocean!
|
|
|
|
|
|
Feedback?
I am always very happy to receive feedback about the Toolbox, and the articles and weapons therein.
Please feel free to contact me by email or phone.
How to contact - click here.
|
|
 Brainy's Share Market Toolbox