|
Dear
Reader,
Welcome to the 7th edition of my weekly
BullCharts software Tip Sheets, focussing on tips and hints relating to
the use of the Australian BullCharts charting software package.
I need to keep this week's Tip Sheet short, because of some tight time
frames. I have only recently finished the January edition of Brainy's
monthly e-Newsletter articles, so I have little time left for this
week's Tip Sheet.
In the January edition e-Newsletter articles I covered the following
topics:
- BullCharts Backup and Restore feature -
why? how? where?
- Share Trading - exactly what is a
company's share actually worth? How do you find out?
- Technical Analysis - Support and
Resistance - including trendlines (which are actually support or
resistance lines), and overhead resistance.
If you are a subscriber to my monthly e-Newsletters, then you already
have access to this material. You can see a preview of the articles
(the first page of each of the four 4-page articles), or consider
subscribing. Click here for more details about Brainy's
Monthly eNewsletter articles (on Technical Analysis, Share Trading and
BullCharts).
Please feel free to send me feedback, or
requests for additional topics .
Topics in this week's Tip Sheet: |
 |
|
Index
for the Tip Sheets Archive
BullCharts
Backup and Restore
Lines
(and trendlines) on charts
BullCharts
HELP for Trendlines
BullCharts
"Snap to Data"
More
information
This
TipSheet might look strange?
|
| BullCharts Backup and Restore |
|
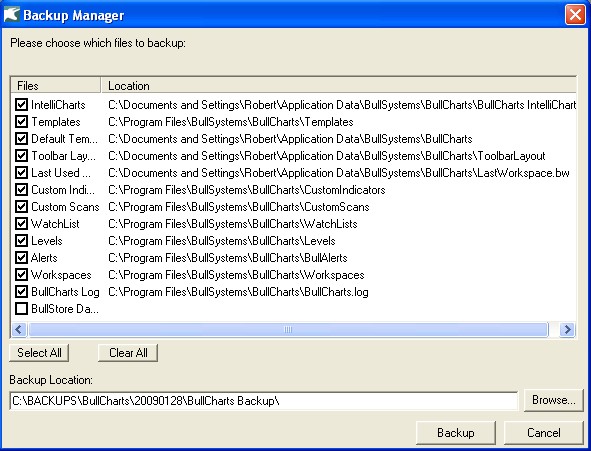 There is a very useful backup and restore feature
in BullCharts (since version 3.6).
Why would you want to use this feature? Well there are a couple of
reasons, the most obvious one of which is just in case something
happens to your files, and you need to reinstate them. Which files? For
a hint, see the screen shot here (click on it to see a larger view).
The worst possible situation would be if your computer was stolen (or
the house burns down, heaven forbid). In a situation like this, could
you manage without your computer and the software? You can easily
reinstall the software, but any data or files that you customised
yourself would be gone.
Of course, you should already have in place a Disaster Recovery Plan
(DRP), or at least a Business Continuity Plan (BCP). You might think
that these are only for large businesses, but they are also very useful
for individual traders. More on this topic in another one of Brainy's
eNewsletter articles soon.
Alternatively, you might have a desktop PC in the home/office, and a
laptop for use on the road. It is possible that the software license
might permit you to have BullCharts installed onto both computers. If
so, how can you keep the various files and data synchronised across
both computers? One way is to take a backup from one computer, copy the
backup files to the other and restore them.
One very useful feature of BullCharts is that many "things" are stored
in separate discrete files, and not all lumped up into a database, or
into a master file. So the BullCharts backup feature provides lots of
flexibility.
In this month's e-Newsletter article (available to subscribers) we take
a look at the various BullCharts files that exist, and which could be
backed up for restoring later; and we look at the various backup and
restore options, and how to do it.
|
| Lines (and trendlines) on charts |
|
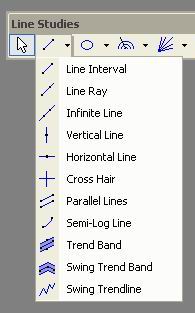 One of the BullCharts tools that many people would
be familiar with is the selection of lines that are available on the
Line Studies Toolbar. The first button on that toolbar has as many as
11 buttons to draw a range of different "lines" on the price chart. See
the accompanying screen shot for the list.
The most common of these would have to be any of the first 3, to draw a
straight line on the chart - as in a trendline. Remember to draw an
uptrend line under a rising price (indicating
support of the price), and a downtrend line above a
falling price (indicating a ceiling resistance line stopping the price
from rising).
Also, a trend line needs to touch at least 2 points on the price chart
to indicate a valid trend. Three points is better.
Some people believe that if the price touches the trend line even more
than this, then it is starting to indicate possible weakening of the
support/resistance line, and a potential break through it.
One option on these first three lines is to "Snap to Data". More on
this in another next section below.
And there is more information on Support and Resistance in the Third
(January) edition of Brainy's monthly e-newsletters (available to
subscribers). Click here for more details.
|
| BullCharts HELP for Trendlines |
|
|
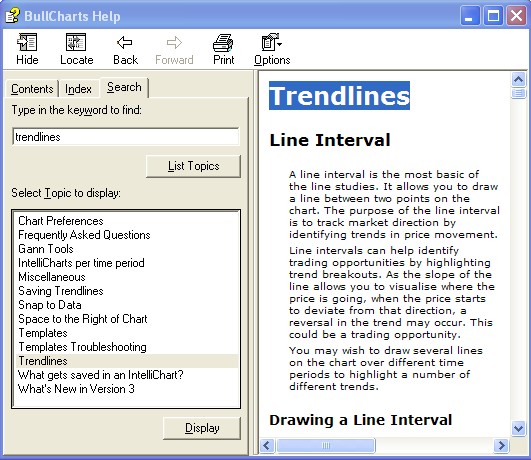
The BullCharts software includes a good Help
facility. With BullCharts running, just hit the F1 function key. See
the accompanying screen shot here (click on it for a larger view).
To see more information in the online Help on the various Line Studies
toolbar buttons for trend lines (all those shown in the screen shot
further above), click on the "Search" tab in the BullCharts Help, then
in the "...keyword to find" field type in trendlines
and either hit the Enter key, or click on the "List Topics" button.
In the displayed list of search results (under the heading "Select
Topic to Display"), scroll down the list to the "Trendlines" entry and
either double-click on it, or click on it once to select it and click
on the "Display" button.
You can then scroll down through the displayed material for more
details about these toolbar options.
|
| BullCharts "Snap to Data" |
|
When you draw these lines on a price chart, there
is an option to "snap to data". But there are a couple of ways you can
use this feature.
Firstly, draw the line on the chart.
Now you can right-click on the line and click on "Snap to data" from
the drop-down menu list. This will snap the two "handles" of the line
to the price data (actually to the Close price). You can then adjust
the location of the line by clicking on one of the handles on the line
and dragging it sideways. But while the "Snap to data" option is on,
the handle will always lock onto a Close price.
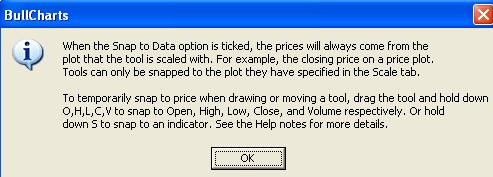
Or, you can right-click on the line and select "Properties" from the
drop-down menu list. In the "Properties" dialogue box, click on the
"Parameters" tab, and notice the check box to the right - "Snap to
data" - which has a link under it that says "Learn more". If you click
on this link you will see the dialogue that is displayed in the
accompanying screen shot to this article above (and you can click on it
to view a larger image).
NOTE the second half of the
text in this dialogue box, about "temporarily snap to price...". By
using the O, H, L, C keys while you move a line's handle, you can snap
a line's handle to any one of a candle's Open, High, Low, or Close
price points. The detailed sequence of steps to snap to a price High
(for example) are as follows:
- Draw the line on the price chart in the
normal way, in roughly the right location.
- Use the mouse left-click to grab
one of the line's handles.
- Drag this handle across the chart
until it is on the desired candle.
- Keep holding the left mouse button
down.
- Now just tap a key on the keyboard
- the letter O for Open, H for High, etc. (note that "tap" the keyboard
means to hit the letter on the keyboard and release - a quick tap).
- Now release the mouse button.
|
| More information |
|
|
More details on some of the topics in these Weekly
Tip Sheets are included in Brainy's Monthly eNewsletters that
are available to subscribers (for a very modest amount). Feel free to
click on the relevant link at right to view samples and more details.
These weekly Tip Sheets for BullCharts* users are intended to be short,
quick grabs of information. They are not a replacement for the monthly
detailed Brainy's eNewsletter articles, which cover these same topics
but in much more detail. The eNewsletters articles also cover Technical
Analysis and Share Trading topics.
Also see the BullCharts on-line help (in BullCharts, hit the F1 key),
and the relevant User Guide Chapter for more details (this is supplied
with the software and copied to your hard drive as a PDF file).
Note: Any screen shots shown in this newsletter are snapped from
BullCharts version 3.8 (which will be available very soon).
FEEDBACK? - I am very keen to receive feedback about these weekly
BullCharts Tipsheets. Please feel free to email me with comments, or
suggestions.
* - BullCharts is: "...an
innovative charting and technical analysis system. It provides a
feature rich and powerful set of tools with access to the latest
strategies from local and overseas authors in analysing the dynamics of
the stock market."
|
| This TipSheet might look strange? |
|
|
This TipSheet has been composed in HTML and
distributed using an online service, and is intended to be viewed in
HTML (ie. web language) format. Some parts might look a little strange,
especially if you are viewing a basically text-only version. I am
working on a text-only version.
We have also found that some web-mail clients (eg. Hotmail and Yahoo
mail) can mess up some aspects.
Please feel free to send me feedback if
anything looks strange.
|
|
|
Index for the Tip Sheets Archive
|
|
|
|
Now that I have a few Tip Sheets
produced, and available from my online Tip Sheet archive, it will be
useful to have an index so that we can all find relevant information
quickly and easily.
So I have now put up a web page that contains just an index of the Tip
Sheet topics. A quick cropped screen shot of the page is shown above,
and you can click on the link to go to that
page.
I will update the page each week to include new material as it is
produced.
|
|