 Brainy's Share Market Toolbox Brainy's Share Market Toolbox
An arsenal of weapons to help you tackle the share market.
|
Monthly Share Market eNews email update
The stories in the price charts...
|
|
|
|
| eNews + eBook Articles Update | #63 - July 2014 |
|
|
|
|
Dear Reader,
Firstly, I must
confess I am running nearly two weeks late with this monthly eNews
email. I spent several days in July working on the latest BullCharts
software beta testing (version 4), and at the Sydney Future Wealth Forum
to help pass on the message to investors and traders that the useful
details for sharemarket investments and stock selection are already in
the charts (and helping to promote BullCharts software). And some of the
discussions in Sydney have influenced the content of this eNews email
this month.
This Share Market eNews email is going to all of our subscribing Share Market Toolbox
Members as normal, and to the non-Members who have expressed an
interest in receiving it. (Any non-members who want to access the detail
in the Members Area can easily join as a Toolbox Member - it's not expensive.)
Understanding the stories in the price charts
Getting started and pulling it all together
In the discussions
with investors and traders at the 3-day Sydney expo/forum in July, it
suddenly dawned on me that over the last almost 6 years while I have
accumulated the wealth of material in my Share Market Toolbox (and the 146 eBook Articles) I have not done a complete job of introducing the subject of Technical Analysis,
and explaining to the relative newbies exactly how to utilise it, and
learn more about it at the same time. So I am starting to rectify that
this month with the material referred to here.
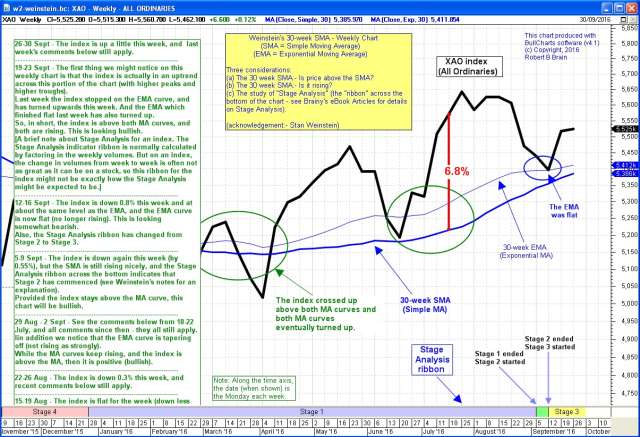
In the price chart
below, note that there are a number of annotations drawn on the chart
(eg. text boxes, lines, etc.) - click on this chart image for a larger
version. This chart is actually a weekly chart of the All Ordinaries
index (XAO), with the 30-week Moving Average chart indicator, and the
Weinstein Stage Analysis ribbon across the bottom of the chart (as per Stan Weinstein's ideas).
As many Toolbox Members will know, this is one of several charts I
maintain and update each week. I add to the running commentary on this
chart every Friday night, with my observations for the week just
finished. These are added into the top of the text box in the lower
portion of this chart.
 | | A chart with annotations |
When
a technical analyst performs some analysis, we really want to record
our observations some where. So, for anyone who is learning how to read
the stories in the price charts, and who wants to record observations in
a useful location, the information in this eNews email below will be
very helpful.
Any non-member who no
longer wants to receive this material on a monthly basis can simply
unsubscribe from ALL topics using the SafeUnsubscribe link at the bottom
- or just Update Your Profile to change your interests. ( BUT NOTE: Toolbox Members and BullCharts mailing list members should not unsubscribe, as it will remove you from all my mail lists.) Please
remember, anything mentioned here, and in the referred eBook Articles,
is for general education only, and is not advice of any sort. Please read on....
|
|
|
|
|
|
|
|
|
|
|
Feedback?
Robert is always very happy to receive feedback about the Toolbox, and the articles and weapons therein.
Please feel free to contact Robert by email or phone.
Contact Us... |
|
|
|
About the eNews emails...
Just a short note to the recently new Toolbox Members:- These share market eNews emails
always go to Toolbox Members (a part of the Toolbox service), and to
the people who have registered to receive occasional information about
the Share Market. This is a monthly email with some pointers and tips
on focused topics - see a quick intro to the eNews emails. They often include references to specific eBook Articles in my Share Market Toolbox, as well as key web pages in the free area of the Toolbox (eg. on the extensive Share Market web page).
I have been writing the eBook Articles since October 2008 - that's
more than five years, and these eNews emails help you to navigate to
related and useful information each month.
|
|
Remember...
Price charts summarise the underlying opinions
and emotions of the market participants.
Every chart tells a story.
It pays to understand the stories in the price charts.
|

This month's focus:
Understanding the stories in the price charts
and pulling it all together

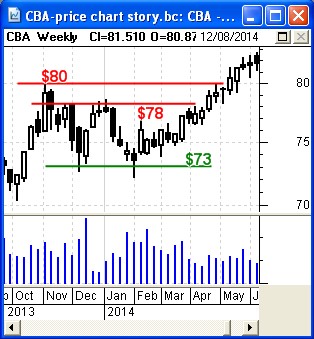
Many people have seen the light, and can understand that the opinions
of market participants are recorded in the price charts, and that the
price chart does indeed tell a story. [This is explained in the chart at
right - click on it for a larger version with more details and
comments, and see the explanation here.]
For anyone who is on their journey of learning more about Technical Analysis,
one challenge is to start practising what they know about the subject.
But that is easier said than done because sometimes we have to analyse a
price chart, and then wait days or weeks (or even months) to see how
accurate the analysis actually was. So we need to easily capture our
observations and analysis details. In this month's updated and
new eBook PDF Articles (listed below), there are a host of tips and
suggestions as to how to go about doing this. And some of the material
focuses on the charting software tool that this analyst uses ( BullCharts software).
Here are the links and details for this month's new and updated eBook Articles:-
- Article TA-1100, "Beginners start here" -
This updated (and free for everyone) 4-page eBook Article is a good
place for the beginners to technical analysis. It provides a quick
overview of the journey ahead. It was first written four years ago, and
is now updated.
- Article TA-1110, "Pulling it all together" -
This new (and free) 5-page eBook Article provides some tips and
suggestions for how to move forward with studying technical analysis,
and practising it at the same time. It mentions that there are many
different things that we might observe when we analyse a price chart,
and which we might want to record on the chart, or with the chart, for
future reference.
- Article BC-03-100, "Saving chart details - overview" -
This updated 4-page eBook Article is now publicly available to everyone
and sets the scene to help the reader understand some of the
alternative methods for capturing chart analysis observations and
comments.
- Article BC-03-110, "Saving chart details and annotations"
- This brand new 5-page eBook Article goes into some detail and
explains how to use BullCharts software to capture your analysis
observations for easy reference later. Basically there are a couple of
options - using the default IntelliCharts feature to automatically
capture chart annotations, or to save the displayed chart as a chart
file. Toolbox non-members can see the free page 1.
Regarding my
growing collection of eBook (PDF) Articles, don't forget to see the
latest Table of Contents pages for all articles (see links in the
side-bar above right). There are now a total of 146 Articles in this collection - a huge total of 673 pages of information! You can see the Table of Contents for all eBook Articles here (recently new or updated ones are highlighted), and the Master Toolbox Index which includes the eBook Articles, plus web page references, and helpful videos.
|
|
eBook (PDF) Articles - Summary
Since October 2008 I have accumulated quite a collection of eBook (PDF) Articles
on three subject areas - Share Trading/Investing, Technical Analysis
and BullCharts software (actually more than 630 pages of material
in more than 138 articles). These Articles are invaluable for both new
and experienced investors and traders. I write brief monthly notes in
this eNews email to highlight specific Articles on targeted topics, and
sometimes referring to new or updated web pages in the Toolbox (also see
a history of Toolbox updates). I am also writing new Articles and updating existing ones as required. For more information please see:
|
|
Article front pages
For any new readers of my Toolbox eBook Articles, there are some useful introductory Articles including an Introduction and an Overview Article for each of the three subject areas. You can see them here:
|
|
Any problems?
What if you have some
sort of problem with accessing the Toolbox and any of these Articles? Or
maybe the Username and Password doesn't work. If there is any problem
at all, simply contact me by email or phone. The best email address for
this is: support@robertbrain.com.
Occasionally emails disappear - the system thinks they are spam, or the
ISP might think they are spam. If I don't reply within a day or so,
please contact me by either email address or phone.
|
In Closing
There
is nothing secret in this email, so feel free to forward it to someone
if you think they might benefit from the information, or from being a
Toolbox Member. The easiest way to do this is to use the "Forward Email"
link at the bottom.
I
am also confident that my Toolbox Members won't be sharing their
username and password with non-members. It is not fair that I spend all
this time preparing the materials, and then my Toolbox Members pay money
to have legitimate access, only to let some people pay nothing to read
and view the details.
Please
feel free to email an individual Article to others as a sample; but if
they want online access to all the materials, it is pretty cheap, so
they should subscribe as a Toolbox Member. There is information about Toolbox Membership in the Quick Links section at right.
Always happy to receive feedback, or suggestions for new content or improvements.
Until next month,
happy investing or trading,
 Robert B. Brain Robert B. Brain
(mobile: 0438 355 910)
ps: watch out for the sharks in the ocean!
|
|
|