|
Dear
Reader,
Well, we are now off to a new calendar year,
and the 4th edition of my weekly BullCharts software Tip Sheets, after
trying to have a couple of weeks off over the Christmas period.
In terms of the markets right now, a lot could be said; but I am not a
licensed financial advisor, so I should not comment on the market. (But
for my own financial "investments", or trades, I am currently sitting
on the sideline, anticipating a 50% likelihood of another severe drop
in the market, before long term consolidation and base building over
several months - so I am looking for a reliable and very careful
strategy for any possible trading - with some back testing for
confidence.)
If you don't have a lot of time to devote to share selection and
trading, you might be watching quarterly charts with a simple indicator
like the Bollinger Bands. And you might watch the XAO index for an
indication of market health. Depending on parameters and how you
interpret the chart, you could have been into the market in July 2003,
and out in April 2008, and missed a lot of the recent carnage. This
topic will be covered in more detail in the Share Trading articles in
my monthly eNewsletters in the near future.
In the meantime, you might want to open up BullCharts and look at a
chart of the XAO (All Ordinaries), quarterly, over this period, with
the Bollinger Bands indicator inserted.
Please feel free to send me feedback, or requests for additional
topics.
Topics in this week's newsletter: |
 |
|
Advanced
trading topics - SPI Gap Filler strategy
Scans in
BullCharts
Scan for
a Breakout
Author
Scans in BullCharts
How to
Customise Scans
More
information
This
TipSheet might look strange?
|
| Scans in BullCharts |
|
|
The scanning module is a key feature of the
BullCharts software product. It allows you to set up one or more stock
selection criteria, and to scan through a specific list of stocks to
identify only those stocks that match the criteria.
In the brief notes below, I briefly touch on a sample trading strategy
and a supplied "author scan" that comes standard with the BullCharts
software.
This topic is covered in much more detail in my monthly eNewsletters -
in particular the second one (reference BC-10-110) in November 2008.
You can see a preview of the BullScan article in that newsletter on
pages 5 and 6 of the preview PDF document (from the web site, follow
the links to Monthly eNewsletters, and then the 2MB PDF preview
document, or just click
on this link to go direct).
Future monthly eNewsletters will look at the basics of how to easily
customise scans, and how to write your own. If you want to receive the
full monthly newsletters you will need to subscribe. You can do that
from the link
to my online shop on this page.
|
| Scan for a Breakout |
|
|
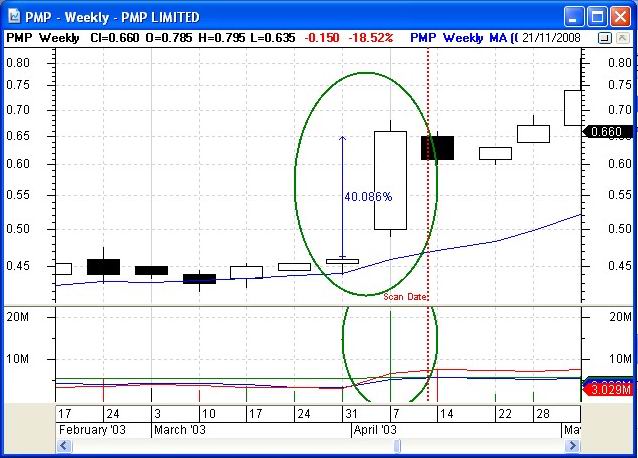
In a bear market environment, we might want to
search for stocks that are "breaking out" above a down trend line, or
above long term resistance. See the sample chart here. Especially on
higher volume (which suggests buyer support for higher share prices).
Let's say you are a longer-term trader, browsing through weekly charts
once each week, and you want to search through all stocks in the
S&P/ASX 200 index for a potential price breakout.
The search (ie. scan) criteria could include:
- The Closing price is between [the
previous Close + 5%], and [the Previous Close + 1000%].
- The Volume is between [the previous
Volume + 30%], and [the previous Volume + 1000%].
- The share price Low crosses above
the 14bar SMA (Simple Moving Average of the Close).
- Close is between 20c and $100.
(Note: there is no suggestion here that this is a
totally successful strategy. You need to do your own analysis to
determine any degree of success or failure.)
|
| Author Scans in BullCharts |
|
|
The BullCharts software comes bundled
with more than 120 supplied scans, and many of these are based on
Author Strategies.
One of the many supplied Author scans in BullCharts is "Leon Wilson's
Breakout" scan. You can find this in the list of Scans (browse the list
of scans, sorted by author).
You should open this scan, and check the scan criteria, and then check
the list of Securities to be scanned (you can easily change this).
|
| How to Customise Scans |
|
|
It is fairly easy to customise scans
in BullCharts to change any of the following:
- Time period - daily, weekly,
monthly, quarterly.
- Scan on the latest end-of-day data
in your local BullCharts database, OR
- Scan "as at" a specific past date
(generally going back as far as 1987).
- The list of securities to scan
through (can be one of your watchlists, or one of the supplied indices,
or sub-index industry groups).
- New scan criteria can be created,
to build up a list of many criteria.
- An existing criteria can be changed
(there are many, many options to choose from).
- The sequence of scan criteria can
be easily changed.
|
| More information |
|
|
More details on scans and how to create and
customise them are included in my monthly eNewsletters that are
available to subscribers (for a very modest amount). Feel free to click
on the relevant link at right to view samples and more details.
These weekly newsletters for BullCharts* users are intended to be
short, quick grabs of information. They are not a replacement for the
monthly detailed eNewsletter that I publish, which might cover these
same topics but in much more detail. The eNewsletters also cover
Technical Analysis and Share Trading topics.
Also see the BullCharts on-line help (in BullCharts, hit the F1 key),
and the relevant User Guide Chapter for more details (this is supplied
with the software and copied to your hard drive as a PDF file).
Note: Any screen shots shown in this newsletter are snapped from
BullCharts version 3.8 (which will be available very soon).
FEEDBACK? - I am very keen to receive feedback about these weekly
BullCharts Tipsheets. Please feel free to email me with comments, or
suggestions.
* - BullCharts
is: "...an innovative charting and technical analysis system.
It provides a feature rich and powerful set of tools with access to the
latest strategies from local and overseas authors in analyzing the
dynamics of the stock market."
|
| This TipSheet might look strange? |
|
|
This TipSheet has been composed in
HTML and distributed using an online service, and is intended to be
viewed in HTML (ie. web language) format. Some parts might look a
little strange, especially if you are viewing a basically text-only
version. I am working on a text-only version.
We have also found that some web-mail clients (eg. Hotmail and Yahoo
mail) can mess up some aspects.
Please feel free to send me feedback if anything looks strange.
|
|
|