|
Dear Reader,
Welcome to the 6th edition of my weekly BullCharts
software Tip Sheets, focussing on tips and hints relating to the use of
the Australian BullCharts charting software package.
The Australian financial reporting season kicks off next week, and runs
for a few weeks. My expectation is that there will be some earnings
surprises, and some shocks with forecast earnings for the next
financial period. As per the infamous Dow Theory, the market discounts
all news. That is, "a lot" of the pending good and bad news is already
factored into share prices. But, I think there will still be some
surprises. People can accept bad news, but we hate surprises.
If there is a surprise that is not already factored in, then a stock
could get punished. If we have too many of these, then it will be
reflected in the index (either XJO and/or XAO, plus others). So, the
index might suffer on the downside over the next few weeks. But then
again, it might not.
If this is going to happen, how can we use BullCharts to our advantage?
Maybe on a daily basis (in the evening after the EOD data download) we
could run a scan that looks for stocks with a high percentage change in
share price (either a rise for considering a long trade, or a price
drop for a possible short trade).
(Please remember that I am not a licensed financial advisor, so I do
not comment on the market and I do not provide any sort of financial or
investing advice. The words here are my own thoughts, just thinking out
loud.)
Enough on the market. In this week's BullCharts Tip Sheet I am offering
some thoughts on how to decide which stocks to search through when
looking for investment opportunities. And relating this to BullCharts
watchlists, and scans.
Much of this information is covered in more detail in my
subscriber-only Brainy's Monthly
eNewsletter articles (on Technical Analysis, Share Trading and
BullCharts).
Please feel free to send
me feedback, or requests for additional topics .
| Investing Dilemma #1 - Which stocks to look through? |
 |
 Everyone faces this dilemma when they start
out with investing or trading. Some people say that you should just
search through the entire market for a stock to invest in. But there
are advantages in severely limiting your long list of possible stocks,
at least until you become more expert.
Everyone who trades should be trading based on a documented and tested
trading strategy. Your trading strategy might limit you to just
Australian stocks - that's fine. But there are roughly 2000 stocks in
the Australian stock market. And it can be a big job to wade through
2000 stocks to find buying opportunities.
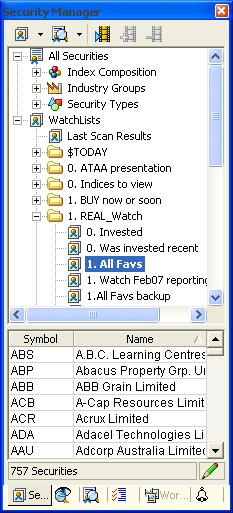
In your BullCharts software you might slowly build up a watchlist like
the one in the accompanying screen shot. This shows the BullCharts
Security Manager window pane with several "folders" under the
"Watchlists" heading. And each folder might contain several different
watchlists. In the sample here, there is one folder called "1.
REAL_Watch", which contains a few watchlists, including one called "1.
All Favs" ("Favs" is shorthand for favourites). Near the bottom of the
screen shot you can see the text "757 Securities" which is the number
of securities in the selected/highlighted watchlist.
(Note: I use a numeral prefix on lists like this to force them to
appear on the screen in a certain sequence - 0, 1 and 2 near the top of
the list, and 7, 8, 9 towards the bottom.) It might take you a while to
build up a watchlist of "favourite stocks" like this one. But then
maybe this is not the smartest way to do this.
If your trading strategy also says that you will only buy stocks with
adequate liquidity, then this narrows down your selection of stocks
significantly. This is a very sound position to take, because if you
need to sell a stock quickly, you want to make sure there are plenty of
buyers in the market. If you have a stock that only trades maybe 3
times per day on average, then you might have a lot of trouble selling
at a time that suits you, and for a favourable price.
Or if you have $20,000 worth of stock to sell, and the average daily
turnover is only $40,000, then dumping half of the daily turnover
amount could seriously affect the share price.
But, what is this thing called "liquidity?..."
|
| What is liquidity? Why is it important? |
|
|
Liquidity (definition): The
ease with which an asset can be converted into cash. When we
talk about the liquidity of a stock in the share market, we could be
referring to any of the following:
- Trades - The number
of trades within a specific period (eg. a day, or week). Here you might
want to invest only in stocks that have had more than, say, 50 trades
in a day (or 250 in a week).
- Value Traded (ie. the
dollar value) - The value of shares traded in a period (money flow or
dollar turnover). You might want to invest only in stocks with more
than, say, $100,000 traded in a day, or perhaps $500,000 in a week.
- Volume - The number of
shares that are traded in a specific period. You might want to make
sure that your buy/sell parcel of shares is no more than, say, 5% of
daily turnover.
By trading only in liquid stocks, you should be
able to exit the stock in a hurry for a reasonable price.
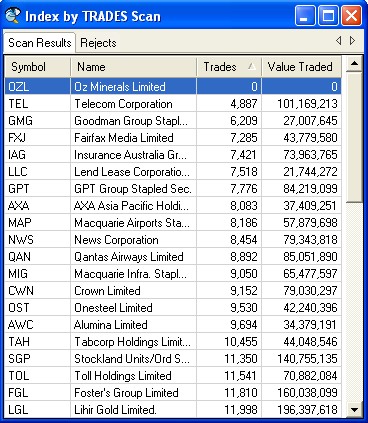
BUT, which stocks have good
liquidity? Normally all stocks in the
S&P/ASX 50 index (for example). See the accompanying screen
shot (click on it for a larger view) which lists the stocks and their
number of trades in a week (in reverse order - lowest to highest, with
only the first few shown). This is the scan results table from a
BullCharts scan (see text below for details). You can see the number of
trades in the last week for Telecom Corp was 4887 - a fair number of
trades.
|
| Which stocks have good liquidity? |
|
The easiest way to find a bunch of stocks
with good liquidity is to use one of the major S&P/ASX indices.
It is really simple.
Use a major index because "good liquidity" is one of the criteria for a
stock to be included in the major indices (refer to the S&P
and ASX web
sites). Stocks with low liquidity will not be included in the key
indices regardless of how big they are (for a simple discussion on how
stocks are chosen to be in an index, refer to my Share Market Boot Camp
seminar materials).
Sample indices for you to look through include the S&P/ASX 20,
50, 100, 200. You can choose any one of these indices (and more) to run
a BullCharts scan on.
NOTE / Exercise: You can use your knowledge and skill of BullScan from
the last 2 BullCharts Tip Sheets to run the following scan and check on
the liquidity of the stocks in these indices:
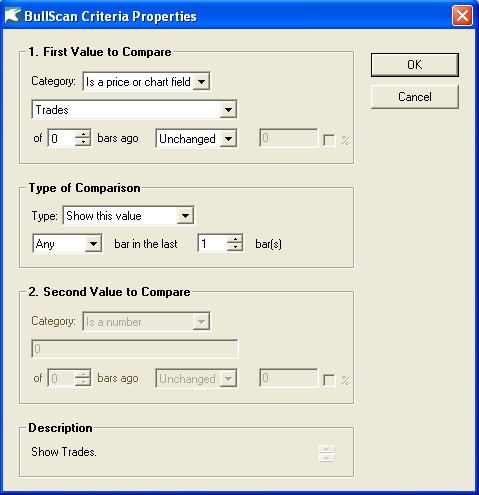
Start BullCharts Create a new scan Create a "New" criteria, and select
"Category" = "Is a price or chart field"; and choose "Trades". for
"Type of Comparison", select: "Show this value" (see the accompanying
screen shot, and click for a larger image). Create another New Criteria
to "Show" the "Value Traded". "Apply" the scan to save it, and "Run"
this scan. In the resulting Scan Results table, you can click on a
column header to sort the list by the values in that column.
|
| Select an index as your BullCharts Watchlist |
|
|
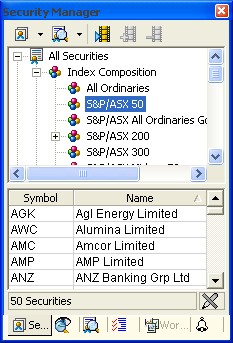
In your BullCharts Security Manager window
pane (see the accompanying screen shot), the upper portion of the
window includes a list of the stocks in each index, and in each sector.
In a BullScan, you can easily select one of these indices as the
"Securities to Scan". Or you can select multiple indices, or watchlists.
I will soon be running a special hands-on BullScan workshop for you to
learn more about the BullCharts scanning feature, and how to use it.
Keep an eye out for details.
|
| More information |
|
|
More details on scans and how to create and
customise them are included in Brainy's Monthly
eNewsletters that are available to subscribers (for a very
modest amount). Feel free to click on the relevant link at right to
view samples and more details.
These weekly Tip Sheets for BullCharts* users are intended to be short,
quick grabs of information. They are not a replacement for the monthly
detailed Brainy's eNewsletter articles, which cover these same topics
but in much more detail. The eNewsletters article also cover Technical
Analysis and Share Trading topics.
Also see the BullCharts on-line help (in BullCharts, hit the F1 key),
and the relevant User Guide Chapter for more details (this is supplied
with the software and copied to your hard drive as a PDF file).
Note: Any screen shots shown in this newsletter are snapped from
BullCharts version 3.8 (which will be available very soon).
FEEDBACK? - I am very keen to receive feedback about these weekly
BullCharts Tipsheets. Please feel free to email me with comments, or
suggestions.
* - BullCharts
is: "...an innovative charting and technical analysis system.
It provides a feature rich and powerful set of tools with access to the
latest strategies from local and overseas authors in analysing the
dynamics of the stock market."
|
| This TipSheet might look strange? |
|
|
This TipSheet has been composed in HTML and
distributed using an online service, and is intended to be viewed in
HTML (ie. web language) format. Some parts might look a little strange,
especially if you are viewing a basically text-only version. I am
working on a text-only version.
We have also found that some web-mail clients (eg. Hotmail and Yahoo
mail) can mess up some aspects.
Please feel free to send
me feedback if anything looks strange.
|
|
|
"Blue Chip" stocks - what does this mean?
|
|
|
|
Definition: Shares, usually highly
valued, in a major company known for its ability to make profits in
good times or in bad, and with reduced risk of default.
In my Share Market Boot Camp
Seminar I touch on this topic, and we spend a few minutes
talking about what the term "Blue Chip" really means.
If you search for a strict definition, you might have trouble finding a
consensus definition. If you ask two different experts for a list of
Australia's blue chip stocks, you will get two somewhat different
lists.
Note the following key points about blue chip companies:
- Are high in market capitalisation
compared with the rest of the market.
- Share price tends to be in the medium to
high bracket (ie. tends not to be low).
- Share price tends to be increasing over
time, but is not guaranteed.
- These stocks are heavily reviewed and
analysed by analysts and brokers, and there are often several market
commentaries and recommendations for each of them.
- Many "advisors" will recommend to stick
with these for various reasons; but this might not be the best advice.
We know for sure that in the current economic
climate, not even a blue chip company is guaranteed to have a robust
share price.
Therefore, if you invest in so-called "blue chip" stocks for the long
term, then your portfolio value today might be down in the order of 20%
to 40%. And, it might take about 3 years or more before your investment
is back to the value it had at the end of 2007.
What we are seeing now is that the "buy and hold" strategy is just not
very good. We can try to convince ourselves that the stocks will come
back. But we would only be kidding ourselves.
But then, maybe it does not matter if your portfolio value is slashed.
This depends on your real reason for buying the stock in the first
place. Perhaps you bought for an income stream from dividends. Perhaps
the share price value does not matter to you? But then, maybe it is
important.
CONCLUSION? Be careful when talking about blue chip stocks - as nothing
is guaranteed. Don't limit your portfolio to just so-called blue chips.
Also, continually monitor your portfolio for poor performers, and sell
them if need be to be preserve your capital.
|
|