|
Dear
Reader,
Welcome to the 8th edition of my weekly
BullCharts software Tip Sheets, focussing on tips and hints relating to
the use of the Australian BullCharts charting software package.
In the January edition of Brainy's eNewsletter Share Trading article
(Document number ST-2500) I talked about how to select shares - that
is, which company? and how to decide, and Blue Chips.
In this Tip Sheet there is some more information about blue chip stocks
(the feature article at right). And in the material below I talk about
some of the features and properties of the Price Pane in BullCharts.
If you have not seen my monthly e-Newsletter articles, you can see a
preview (the first page of each of the four 4-page articles). Click here for more details about Brainy's
Monthly eNewsletter articles (on Technical Analysis, Share Trading and
BullCharts).
Please feel free to send me feedback, or
requests for additional topics .
Topics in this week's Tip Sheet: |
 |
|
More on
Blue Chip stocks
BullCharts
Price Charts - basic features
(and "space to the right")
Price
chart window - Title Bar
Price
Pane Properties
Price
Pane title bar
More
information
This
TipSheet might look strange?
|
BullCharts Price Charts - basic features
(and "space to the right") |
|
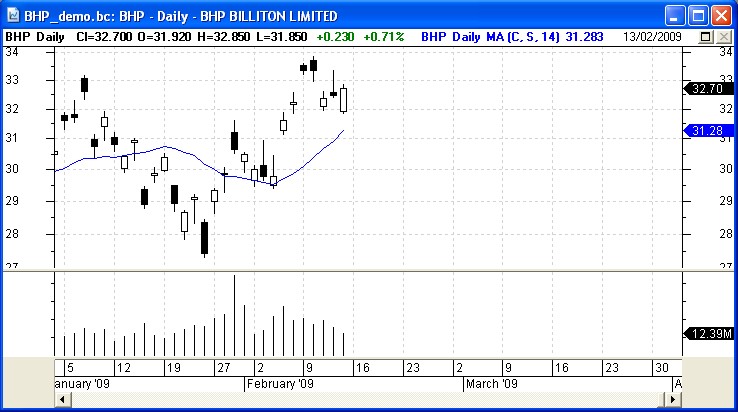 The notes further below refer to the screen shot
here (click on it for a larger version).
The very first thing to note is that this screen shot appears to be a
window of its own, with the blue Windows title bar across the top. If
this was "maximised" within the BullCharts window, you would not see
the blue title bar; but all other features are pretty much the same.
The steps to "maximise" and "restore" this price chart in the
BullCharts window are exactly the same as in other Windows programs. It
is easiest to use the three small "buttons" in the upper right hand
corner of the window - the first one will "minimise" the window and
"restore" the window; the middle one will "maximise" and "restore" the
window, and the right-hand one (the cross in the red square) will close
the window.
Note that this Price Chart has two Price Panes - the price plot itself,
and the volume pane in the lower portion. You can right-click the mouse
on either pane for a dialogue box of properties options for the pane
(more details below).
You might also notice that this price plot has a large amount of space
to the right. To change this, right- click over the time axis and
select "Time Axis Properties", then enter a value for "Space to the
right of chart".
|
| Price chart window - Title Bar |
|
|
Across the top of the price chart
window in the blue Windows title bar there are a couple of pieces of
information (assuming that the window is "restored" and not
"maximised").
- If you have "saved" the chart as a
file (using the menu option File > SaveAs), then the first piece
of text is the name of the saved file. In the sample above, the
filename is "BHP_demo.bc"
- "BHP" - is the next piece of text
in the sample above - the stock code.
- "Daily" - is the time frame for
this chart (as opposed to weekly, monthly, etc.)
- "BHP BILLITON LIMITED" - the name
of the stock.
|
| Price Pane Properties |
|
|
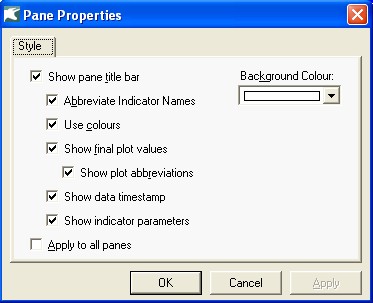
You can right-click on any pane on the price chart,
and select "Pane Properties..." from the drop down menu. The dialogue
box is as shown in the accompanying screen shot.
One good way to understand each of the options is to play with them and
note the effect they have.
Some of these are covered in the text below.
|
| Price Pane title bar |
|
|
Just under the blue Windows title bar
is the title bar for the Price Pane. It is possible to turn off the
display of this pane title bar - right-click any where on the pane and
select "Pane Properties" from the drop down menu, then "Show pane title
bar" can be turned on or off.
In the sample screen shot above there are a number of pieces of very
useful information as follows.
- "BHP Daily" - The stock code, and
time frame.
- "Cl=32.7000 O=31.920 H=32.850
L=31.850" - These are obviously the Close, Open, High and Low price.
What might not be so obvious, is that these prices refer to the very
last candle on the chart. These can be omitted from display (in Pane
Properties > "Show final plot values").
- "+0.230 +0.71%" - These two values
are the price change between the last candle and the one before (in
dollars, and in percent). So if you want to quickly know the amount of
price difference on the chart between the last two candles, simply look
at the price pane title bar.
- "BHP Daily MA (C, S, 14) 31.283" -
This is the indicator being displayed, and the parameters for the
indicator (the "indicator parameters" can be displayed or not - see
"Pane Properties"). In this case, the items shown here are as follows:
- "BHP Daily" - self explanatory
- "MA" - Moving Average
- C - The MA is based on Close
prices (as opposed to Open, High, Low)
- S - The MA is a Simple (as
opposed to Exponential, Weighted, etc.)
- 14 - The MA is a 14 period MA.
- 31.283- This is the actual
value of the MA for the last candle on the chart.
Note that with several indicators shown on the chart, the codes and
parameters for each of them will be displayed and might run off the
right side of the screen (unless you have a nice wide screen). The
sequence of these across the screen can be changed.
The very first entry is normally the price plot details, because this
chart element is actually drawn on the chart at the "back" of the
chart. That is, it is "behind" the other elements.
You can change the sequence of items on the chart by moving one
"forward" or "back". To do this, left-click once on either the price
plot itself, or on an indicator, to select that element. Once it is
selected some "handles" will appear along the element (the handles are
small squares). Now right-click on the element and from the drop-down
menu select "Order", and then choose an option. (Note: this is exactly
the same as in Microsoft Powerpoint, and OpenOffice Impress - except it
might be called "arrange" instead of "order").
|
| More information |
|
|
More details on some of the topics in these Weekly
Tip Sheets are included in Brainy's Monthly eNewsletters that
are available to subscribers (for a very modest amount). Feel free to
click on the relevant link at right to view samples and more details.
These weekly Tip Sheets for BullCharts* users are intended to be short,
quick grabs of information. They are not a replacement for the monthly
detailed Brainy's eNewsletter articles, which cover these same topics
but in much more detail. The eNewsletters articles also cover Technical
Analysis and Share Trading topics.
Also see the BullCharts on-line help (in BullCharts, hit the F1 key),
and the relevant User Guide Chapter for more details (this is supplied
with the software and copied to your hard drive as a PDF file).
Note: Any screen shots shown in this newsletter are snapped from
BullCharts version 3.8 (which will be available very soon).
FEEDBACK? - I am very keen to receive feedback about these weekly
BullCharts Tipsheets. Please feel free to email me with comments, or
suggestions.
* - BullCharts is: "...an
innovative charting and technical analysis system. It provides a
feature rich and powerful set of tools with access to the latest
strategies from local and overseas authors in analysing the dynamics of
the stock market."
|
| This TipSheet might look strange? |
|
|
This TipSheet has been composed in HTML and
distributed using an online service, and is intended to be viewed in
HTML (ie. web language) format. Some parts might look a little strange,
especially if you are viewing a basically text-only version. I am
working on a text-only version.
We have also found that some web-mail clients (eg. Hotmail and Yahoo
mail) can mess up some aspects.
Please feel free to send me feedback if
anything looks strange.
|
|
|
More on Blue Chip stocks
|
|
|
|
Perhaps you are an experienced trader, with one (or
more) successful trading strategies, in which case the tip below might
not be too useful.
But if you are trying to work through the mine field and work out how
to search through all the available stocks, there are some resources
available to help.
To help narrow down your selection of companies, you could focus on
companies that are in good health, with good management, who produce
profits year after year. There are a number of resources available to
help with this.
The Lincoln Indicators company has a
product called Stock Doctor.
Stock Doctor is available by subscription, and is a very good tool to
search through stocks based on company fundamentals. The software has a
number of criteria that are used to rate companies as "quality"
companies, and rate the better ones as "Star Stocks". You should see
their web site for more details.
There are a also a number of books available each year to assist. One
of these is Martin Roth's "Top Stocks". If you are trying to
distinguish which companies are "quality" companies, then this book
will help.
It is available from Janene's Educated Investor bookshop in Collins
Street, Melbourne. See this web page for details.
|
|