|
Dear
Reader,
Welcome to the 13th edition of my (normally
fortnightly) BullCharts software Tip Sheets, focussing on tips and
hints regarding the Australian BullCharts charting software package.
I have been very busy over the last few weeks with a couple of things.
I have totally revamped my web site to make it much easier
to navigate. With the special panel of useful links down the left-hand
side (the navigation panel).
I have sourced a good venue for my Hands-On Trading
Workshop, in Vermont South, just off Burwood
Highway, not far from the Vermont South Shopping Centre (in Melbourne's
eastern suburbs). So I have scheduled another workshop for Thursday
21st May (this week!!). I only have a couple of seats left, so if you
are interested you need to register quickly. See the "Workshops and
Seminars" link on my Home Page. Session runs from 6:30pm to 9pm (ie.
2.5 hours). You can click here for more details.
More Workshop details are included in the side bar on the
right. A fantastic opportunity to try safe CFD trading on an
overseas market in the early evening - and it's not your money. And the
computers are set up like real trading workstations with dual monitors.
It will be a great event. (BTW - I will soon be running BullCharts
hands-on workshops at this same venue - stay
tuned).
I have also been busy preparing for my NEW and FREE seminar - "The
10 Key Lessons from the GFC" seminar (ie. the
Global Financial Crisis). Everyone is welcome to attend, and you can
bring your family and friends (but we are limited to 30 seats). It will
be at The Leighoak Hotel (same venue as our BullCharts User Group
meetings) on Wednesday 20th May (this week!!). See the "Workshops and
Seminars" link on my Home Page. Session runs from 7pm to 8:30pm. Free
hand-outs are available to those who register - so registration is
necessary. You can click here for more details.
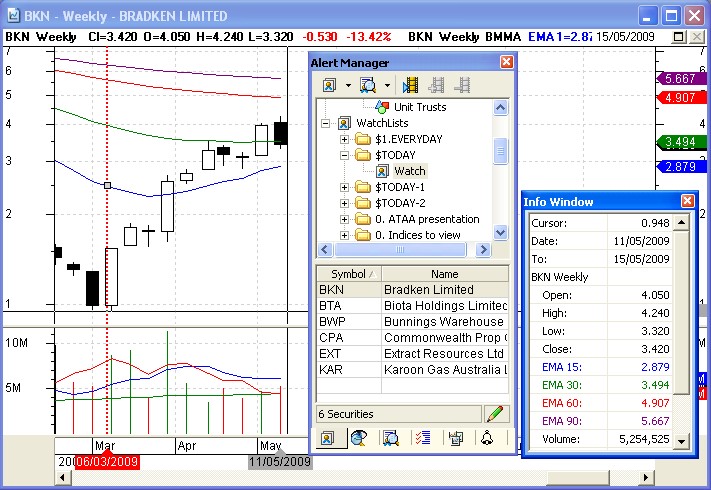
In this Tip Sheet below we look at a
couple of things that are all demonstrated in the screen shot below
(you can click on it for a larger image) - the Info Window, and an
option in some of the BullCharts tools called "This tool is relevant to
this security only" (in the screen shot below it is the vertical dotted
red line).
The first thing discussed below is a possible trading strategy, or at
least selection criteria to look for stocks for purchase in the current
market environment.
I am always happy to receive feedback and suggestions for these Tip
Sheets. Or if anything in a Tip Sheet is not clear, please feel free to
contact me to ask about it (by email or phone).
Please feel free to send me feedback, or
requests for additional topics for these Tip Sheets or the
monthly eNewsletter articles.
Good luck with your trading.
Robert ("Brainy") Brain
(Contact details below.)
Topics in this Tip Sheet edition: |
 |
|
Hands-on
Trading Workshop
Which
stocks to buy?
Features
of the Displayed Chart
"This
tool is relevant to this security only"
I found
an uptrend!
More
information
This
TipSheet might look strange?
|
| Which stocks to buy? |
|
|
The biggest dilemma for all traders is
the question: "which stock should I look at buying?".
Okay, so how can you find a good stock to buy? Of course, this depends
on your documented trading strategy. But conventional wisdom says that
"the trend is your friend". That is, find a stock that is confirmed to
be up-trending, and consider buying it.
Okay, so how can we find up-trending stocks?
One way is to take your preferred list of stocks which you will have in
a watchlist. This might be either a watchlist that you have built up by
adding stocks to the list over time. Or you might be content with
watching the stocks in an index such as the S&P/ASX 200 (ie.
the XJO - you can chart this in BullCharts just like any other
security).
Now, with your preferred list of stocks in a watchlist, you could view
a chart of each stock once a week and look to see if it is in a
confirmed uptrend.
To help do this, you might put a couple of Moving Average indicators on
the chart.
The chart that you use to do this might look like the sample chart
shown below, and described in the next section below.
The chart below has a vertical line
placed at the last significant low (6 March 2009 which might be our
bear market bottom).
You could step through the stocks in your watchlist, and view the chart
to see which stock appears to be in a confirmed uptrend. But notice
that the vertical line you placed on the chart might disappear when you
switch stocks. You can force this line to remain displayed. This is
explained below.
Note that the vertical line that you can place on the chart might
disappear when you switch securities; but might reappear when you go
back to the original stock. If this happens, it will be because the
IntelliCharts feature is turned on.
|
| Features of the Displayed Chart |
|
|
The following notes refer to the displayed chart
(click on it for a larger image).
- It is a Weekly chart of Bradken (BKN)
from late February until today.
- The very top bar of any window is
known as the "Title Bar", and in this example is coloured blue (using
the Windows XP Classic colour scheme).
- The second row of this window is
the BullCharts Pane Title Bar, and can be turned off if you don't want
to see it. But it does show lots of useful information. In this example
it shows the following few items.
- The security - BKN, and the time
period - Weekly. Followed by the Close, Open, High and Low prices for
the day (these might be shown further along this bar if you have
changed the "Order" of displayed items - front to back, etc. The red
text is the price change between the last two candles (in dollars and
cents, and in percentage). Then information about the indicators is
displayed (but only the first few characters can be displayed).
- You can change the sequence of some
of the items along the Pane Title Bar as follows: right click on one
element in the price chart (eg. a candle, or an indicator) and then
choose "Order" from the drop-down menu, and click on one option (eg.
"Bring to front").
- The date of the latest day's data
is in the top right hand corner "15/05/2009" at the right hand end of
the Pane Title Bar.
- The red dotted vertical line is
placed on the date of the last significant market low, which might be
our bear market bottom (6 March 2009).
- The "Security Manager" panel is
displayed, and is "floating" in the window (ie. it is "un-docked"). It
shows my Watchlists, including several Watchlist folders, one of which
is called "$TODAY" (I use a dollar sign to force it towards the top of
the list in alphabetic order). This watchlist folder contains one
watchlist called "Watch". The lower portion shows a list of stocks in
this watchlist.
- The Cross-Hair cursor is enabled
(you can toggle this on/off with a toolbar button). It appears as a
fine vertical line and a fine horizontal line on the chart. The mouse
cursor is where these two lines cross each other, and is positioned on
11/05/2009.
- The "Info Window" is displayed, and
it shows the values of all candle and indicator elements for the date
where the cursor is positioned. eg. "Cursor" = latest Close price;
"Date" and "To" indicate the weekly range for the selected candle -
because it is a weekly chart.
- The four coloured Moving Average
indicator lines on the chart are my own indicator called "BMMA" (this
is indicated in the Pane Title Bar). The Info Window shows these MA
values as all EMA (ie. Exponential Moving Average), and with the four
values: 15, 30, 60 and 90.
- The lower pane is Volume, with a
couple of changes:- the Properties of the Volume are changed to show
the Colour as: "Price change since previous", and there are three
Moving Averages (Simple MA - 5, 10 and 50).
Some of these items are described in more detail
below.
|
| "This tool is relevant to this security only" |
|
|
In the sample price chart above, you
can force the vertical red dashed line to remain on the chart while you
view different stocks. It is actually quite simple (but not obvious).
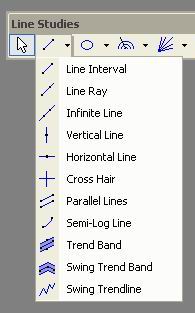
Firstly, open a new price chart, and add a Vertical Line to the chart
(using the Vertical Lines toolbar button - see the adjacent screen
shot). In the sample I have changed the Vertical Line Properties (on
the "Style" tab): Colour = red; Style = a dotted line; and "Line
Thickness" is a little thicker. Then on the "Advanced" tab there is one
option called "This tool is relevant to this security only" - and I
unticked the check box. It is that simple.
Now when I step through the stocks in my watchlist, this vertical red
line stays on the chart to mark the last significant market low. It is
my reference point to look for the start of a new up trend.
|
| I found an uptrend! |
|
 Question: "Okay, I think I have found an
uptrend with some of my stocks in my watchlist using the method above.
So, can I buy them now?"
Well, this is where it is important to have your own trading strategy
clearly defined and tested. The first step in stock selection is to
identify a "possible" purchase. The next step is to search for
"confirmation". This might be based on one or more indicators. Or
perhaps on levels of Support and Resistance on the chart. Or maybe on
Candle patterns. This is your choice, using a tested approach.
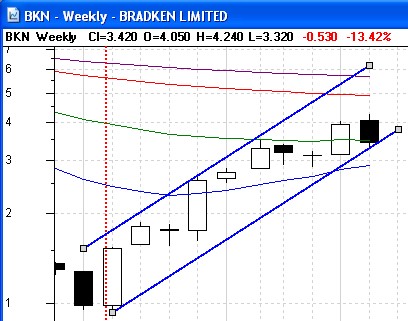
You might also want to look at whether the stock is currently trading
near the lows of its recent "Trading Range". If you can put a "Channel"
around the price action of recent weeks, and if it is trading close to
the highs of the channel, then it might be due for prices to come back
down to the lower side of the channel.
In the sample price chart above, a channel has been put around the
price action, using the "Parallel Lines" toolbar button.
If the price action is closer to the bottom line of the channel (as in
the sample above), then the price might be due to rebound up, OR it
might be about to fall down out of the channel. This all depends on
your own back-tested trading strategy.
NOTE: It can be argued that the channel placed on this sample chart is
not a valid channel because the bottom line does not correctly indicate
a rising trend, and so serves no purpose. But it illustrates the
example.
For information about Trading Strategies, and some templates to help
you pull together a strategy, you can look at the articles in the
"Share Trading" editions of my Monthly eNewsletter articles (in Oct and
Nov 2008, and April 2009). To see just the Table of Contents page for
the Share Trading articles, click here....
Or you can see a preview of each month's articles here.
Good luck with your trading journey, and your increasing knowledge of
the BullCharts software package.
See the link at right for more details about the eNewsletter articles.
|
| More information |
|
|
More details on some of the topics in these Weekly
Tip Sheets are included in Brainy's Monthly eNewsletters that
are available to subscribers (for a very modest amount). Feel free to
click on the relevant link at right to view samples and more details.
These weekly Tip Sheets for BullCharts* users are intended to be short,
quick grabs of information. They are not a replacement for the monthly
detailed Brainy's eNewsletter articles, which cover these same topics
but in much more detail. The eNewsletters articles also cover Technical
Analysis and Share Trading topics.
Also see the BullCharts on-line help (in BullCharts, hit the F1 key),
and the relevant User Guide Chapter for more details (this is supplied
with the software and copied to your hard drive as a PDF file).
Note: Any screen shots shown in this newsletter are snapped from
BullCharts version 3.8.
FEEDBACK? - I am very keen to receive feedback about these weekly
BullCharts Tipsheets. Please feel free to email me with comments, or
suggestions. Contact details are included below.
* - BullCharts is: "...an
innovative charting and technical analysis system. It provides a
feature rich and powerful set of tools with access to the latest
strategies from local and overseas authors in analysing the dynamics of
the stock market."
|
| This TipSheet might look strange? |
|
|
This TipSheet has been composed in HTML and
distributed using an online service, and is intended to be viewed in
HTML (ie. web language) format. Some parts might look a little strange,
especially if you are viewing a basically text-only version. I am
working on a text-only version.
We have also found that some web-mail clients (eg. Hotmail and Yahoo
mail) can mess up some aspects.
Please feel free to send me feedback
if anything looks strange.
Good luck with your trading.
Robert ("Brainy") Brain
|
|
|
Hands-on
Trading Workshop
|
|
|
|
A fantastic 2½ hour hands-on workshop session where
you can really trade CFDs in the early evening on an overseas market.
Find out what it is really like to
trade CFDs - using signals on a 1-minute price chart.
Been thinking about getting into share trading or CFDs, and not sure
where to start?
In this hands-on workshop you will:
- Open a demo account with a CFD broker;
- Trade CFDs;
- Trade an overseas market;
- Trade in the early evening.
But not only that, you will learn about:
- CFDs - what are they?
- How to go short (ie. sell them
without owning them).
- How to read price charts.
- Support and Resistance.
- The Parabolic-SAR indicator.
- How to use Trading Plans and
Strategies to improve your trading success.
How to maximise profit and reduce risk in today's
market environment.
Using "fantasy money" so you can really go for it - no holding back.
More details including information on how to register are on my
web site. You can register at my secure outsourced OnLine
Shop with credit card or PayPal, or print the registration form and
send it in the mail (but if sending by mail, please ring me first to
reserve a seat).
The workshop venue is the Vermont South Community House with computers
set-up like real Trading Workstations with dual-monitors.
|
|