|
Dear Reader,
Welcome to the 21st edition of my BullCharts
software Tip Sheets, focusing on tips and hints for BullCharts (the
Australian charting software package).
I am sending this Tip Sheet to both the
BullCharts users and my Toolbox Members for interest.
I had one of those "ah ha!" moments this weekend when I realised a very
effective way to
easily handle candlestick patterns (this happened while I
was doing my weekly market analysis for the Weekly
Market email that I send to Toolbox
Members). We can follow the steps below to quickly learn
more about all those fancy candlestick patterns, and
work out which is which.
So this Tip Sheet concentrates on two things
"Candlestick Patterns", and the "BullCharts
Layer Manager". Yes, the Layer Manager!
Read on!!.....
Don't
forget I am now an authorised BullCharts reseller, offering free
tuition to those who
purchase through me. So encourage others to visit the BullCharts
section of my
Share Market Toolbox web site so they can
benefit from the special offers (my Toolbox
is an arsenal of
weapons to help you tackle the share market).
And the Tip
Sheet Archive Section
for a chronological list of past Tip Sheets and the Index
page for a detailed list of the topics covered.
I am
always happy to receive feedback and
suggestions for these Tip Sheets (and my
Toolbox web site). Or if anything in a Tip
Sheet is not clear, please feel free to
contact me to ask about it (by email or
phone). Or maybe I have made a mistake,
which I will be pleased to correct in the
next Tip Sheet along with an acknowledgement
for whoever spots it first.
Please feel free to
send me feedback, or requests for additional
topics for these Tip Sheets or the
monthly eNewsletter eBook Articles.
Good luck with your trading.
Robert Brain (aka Brainy)
(Contact details below.)
Topics in this Tip Sheet edition: |
 |
|
Seminars
- March 2010
Confused
by Candles?
BullCharts
Candle Pattern Indicator
The
Layer Manager
How
to use this?
More
information
This
TipSheet might look strange?
|
| Confused by Candles? |
|
|
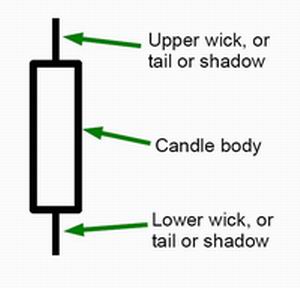
Many people feel that candlestick charts are
easier to read and interpret than bar (OHLC) charts. If
you are starting out, you might still be a little
puzzled about how to read the humble candle. That's okay,
everyone has to start some where.
So, what is the difference between the black
candles and the white ones, or the red ones and green
ones? Or perhaps you are trying to understand how to interpret the open
price versus the close price.
Take a look at my new web page (still in
basic form, but will be expanded) - How
to understand candlestick price charts. It
is basic, and might help you.
|
| BullCharts Candle Pattern Indicator |
|
There are a myriad of candlestick patterns,
and there are specific "shapes" and corresponding names
for single-candles (eg. doji, marabozu,
shaven...), as well as many multi-candle patterns (3 black crows,
Rising Three Method,...). And they all have their
own unique names. To see more a lot more detail about
pattern names, see the link above to my
simple Candlestick page, and the "Useful
Links" section on that page.
BullCharts includes a Candle Patterns
indicator. My Toolbox Members will know that I wrote a 5-page eBook
Article about it a couple of months ago
- BC-08-200,
"BullCharts Candle Patterns Indicator" (available to my
Toolbox Members). It names just some of the more common candle
patterns, and explains this BullCharts indicator.
If you are not a Toolbox Member, you can see page
1 of the eBook Article
here.
In the rest of this Tip Sheet, I will assume
that you know how to "Insert" this indicator onto a
BullCharts price chart. If not, it is just like any
other BullCharts indicator. You can refer to the eBook Article.
|
| The Layer Manager |
|
Okay, open up BullCharts, and create a new price
chart (eg. for BHP), then "Insert" the Candle
Pattern indicator (see my eBook
Article
mentioned above).
Note that it might take a few seconds for
BullCharts to work through your price chart, and identify
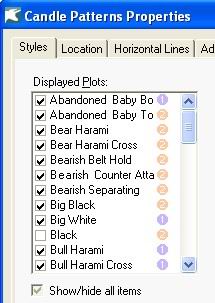
the candle patterns to flag. Also note that by default
this indicator only flags a handful of candle patterns. To
display more patterns, or fewer, you need to view the properties of the
indicator, and tick or
untick the checkbox for each of about 50 candle
patterns. But it is easier to do this using the Layer Manager
(the details are below).
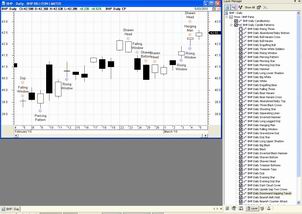
Now, open up the Layer Manager, and your chart might look like the one
in the accompanying
screen shot (click on it for a larger image).
If you are not sure about the Layer Manager,
I have not yet written a Tip Sheet about it
(perhaps I
should have). But I have written a 4-page eBook
Article, BC-40-100,
"BullCharts
Layer Manager" (available to Toolbox
Members), or non-Members can see page
1 here. (In the
Control Panel / Security Manager, note the
tabs across the bottom - it is usually the
fourth one.
Don't forget that the Layer Manager
(introduced in BullCharts v3.8), is actually within the
Control Panel window pane which can be re-sized by dragging
the left-hand border to the left or right. You
can also grab the Title Line in the Control Panel, and move it towards
the centre of the window in order to
"undock" it from around the edge of the BullCharts window.
|
| How to use this? |
|
Okay, we have BullCharts open, and a price
chart of a stock with the Candle Pattern indicator
displayed, and the Layer Manager open. So, what's the big deal?
Well, if you want to display or hide specific
candle patterns, you normally need to view and
change the Properties of the indicator (as I mentioned
above).
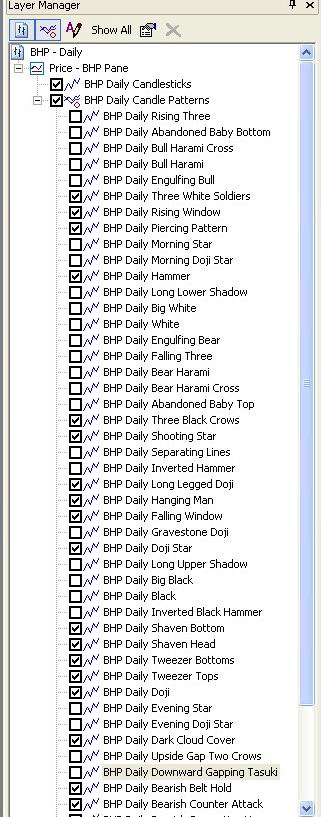
OR, the easier way to do this is to look at
the Layer Manager window pane (see the accompanying
screen shot - click on it for a larger image
- and then zoom in to see more clearly), and
simply tick or
untick the required boxes. Make sure to wait a few
seconds for your computer and BullCharts to work through
all the known patterns (watch for the small information message
"Calculating..." in the top left
corner of your BullCharts screen).
If you have an interest in a specific candle
pattern, you can zoom your price chart out to view a lot more history,
and simply select the pattern in the
Layer Manager.
If you are interested in learning more about
many of these candle patterns, you can do the same
thing. Simply work down the list of patterns in the
Layer Manager, and tick them on/off one at a time
(or three or four at a time).
|
| More information |
|
|
More details on some of the topics in these Weekly
Tip Sheets are included in Brainy's
Monthly eNewsletters that are now bundled into Brainy's
Share Market Toolbox Membership privileges. Feel
free to click on the relevant link at right to view samples and more
details.
These weekly Tip Sheets for BullCharts* users are intended to be short,
quick grabs of information. They are not a replacement for the monthly
detailed Brainy's eNewsletter articles, which cover these same topics
but in much more detail. The eNewsletters Articles also cover Technical
Analysis and Share Trading topics.
Also see the BullCharts on-line help (in BullCharts, hit the F1 key),
and the relevant User Guide Chapter for more details (this is supplied
with the software and copied to your hard drive as a PDF file).
Note: Any screen shots shown in this newsletter are snapped from
BullCharts version 3.8.2.
FEEDBACK? - I am very keen to receive feedback about these weekly
BullCharts Tipsheets. Please feel free to email me with comments, or
suggestions. Contact details are included below.
* - BullCharts
is: "...an innovative charting and technical analysis system.
It provides a feature rich and powerful set of tools with access to the
latest strategies from local and overseas authors in analysing the
dynamics of the stock market."
|
| This TipSheet might look strange? |
|
|
This TipSheet has been composed in HTML and
distributed using an online service, and is
intended to be viewed in HTML (ie. web language) format. Some parts
might look a little strange, especially
if you are viewing a basically text-only version. I am
working on a text-only version.
We have also found that some web-mail clients
(eg. Hotmail and Yahoo mail) can mess up some aspects.
Please feel free to send me feedback if
anything looks strange.
Good luck with your trading.
Robert Brain (aka Brainy)
|
|
|
Seminars
- March 2010
|
|
|
|
Want to learn more about the share market? or
about that ginormous topic of charting?
My next two scheduled seminars are:
You just can't afford to miss either these.
They are happening very soon - in a week or so. Session details,
dates, costs, venue, etc. are on my
web site here.
And I am currently offering some special
incentives to encourage you to come along to a seminar -
see the Special
Discount details here.
At this stage there are no BullCharts
training workshops planned (there does not
seem to be enough
interest). If you are interested in a topic,
please feel free to contact me to discuss the
options.
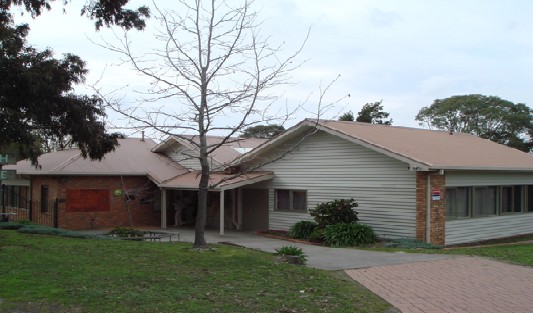
The regular venue I now use for most sessions
is the Vermont South Community House (VSCH).
To enrol for any of these, you need to
contact the
VSCH directly by phone or email.
If you have any questions, please feel
free to email or phone me (or catchup at a
BullCharts User Group meeting, or an ATAA
meeting - I am now the Victorian Chapter
Vice-President, and a National ATAA Board
Member).
|
|