 |
Brainy'sShare Market Analysis
|
|
One of
the tools in Brainy's Share Market Toolbox
to help investors and traders to navigate the share market.
The analysis approaches
and methods described here are mostly on one of our market
indexes.
But the methods are equally relevant and useful when applied to
individual companies in any country.
So if we understand the ideas and master the methods, it will
all make
perfect sense.
You are here:
Share Market Toolbox
> Share Market Analysis
Related links: Weekly
Analysis
(members); Bear
Markets Analysis; Bull
Markets Analysis;
Robert's
Weekly Watch List; Robert's
investing
/ trading philosophy; Technical
Analysis;
"4 Windows " approach;
|
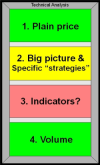
Each week (on a Friday night) Robert utilises a small collection of share market price charts and technical analysis indicators to determine the overall state of health of the Aussie share market. This analysis tells us whether the market is healthy (as in a bull market), or not healthy (as in a bear market). And this utilises the "4 Windows" analysis approach. By following the detail each week you will be better prepared to take advantage of opportunities in the market. Quick Links:
This analysis utilises tools, concepts and ideas
from Stan
Weinstein, Daryl Guppy, Jake
Bernstein, and Colin Twiggs. And it uses
the BullCharts
charting software to display the price charts. As a part of his own trading strategy, Robert does a detailed analysis in the same format on a weekly basis, and posts the updated observations in the Members Area of the Share Market Toolbox for subscribing Toolbox Members to see. Robert also sends a weekly summary comment by email to subscribing Toolbox Members. The registered casual Toolbox users receive this only once each month. See a sample of the Members-only Weekly Market Update here.... |
How often
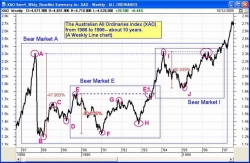
do we see a bear market*, You might be very surprised at how often they occur. And you might be surprised at how long they last. (On the Australian market they occur about once every 3 or 4 years, and thte market can take up to 10 years before it makes new highs). Robert has done a detailed analysis of all Bear Markets and Corrections in the Australian share market since 1987. The results of this analysis, complete with charts and comments, are included in the Members Area of the Share Market Toolbox. Quick Links:
* - By common definition, a bear
market is a fall of more than 20 percent, while a
market correction
is a fall of more than 10 percent, but less than 20
percent. |
Robert has done a detailed analysis of all Bull Markets in the Australian share market since 1987. The results of this analysis, complete with charts and comments, are included in the Members Area of the Share Market Toolbox. Quick Links:
Not a Toolbox Member? - see details.
|
Is this type of analysis useful?
On a weekly basis, Robert views a handful of price charts of our major market index. These are previewed in the public high-level analysis mentioned above. His analysis of Bull and Bear markets (also mentioned above) has led to a few conclusions. One of which is that we need to be both a little nimble, and rather sensible with our investing. In fact, Robert is a nimble short term investor. If
we can see a bear market developing, we should consider
changing some,
or all, of our stocks into cash to ride out the storm.
This is
protecting our capital from downside risk. If the market
starts
falling, who knows how far it will fall before
recovering to new highs?
Remember the real
truth about blue chip shares which can be very
dissapointing. But, of course, the action we take should
be according
to our own
investing
and trading strategy which needs to be written
down somewhere. Here Robert studies the All Ordinaries (XAO) index - but why? Well, it is the top 500 stocks in the Aussie market. If the index is moving up, it means that a number of key stocks within the index are rising. And conversely, if the index is falling, then a number of key stocks in the index are falling. If we watch the XAO index, and take note of what it is doing, it gives us a reasonable understanding of the market as a whole. Some people use this as a "filter". That is, if the analysis says we are in a falling market, then they do not buy into the market (but in fact a very nimble investor who knows that not all stocks fall in a falling market will still find opportunities, and use prudent risk management). If a healthy bull market is under way, then it is much easier to have profitable investments. And, this type of analysis can be applied to individual company price charts, not just the market index. |
TestimonialsSee the testimonials to read what people have to sayabout Robert's Share Market Analysis materials. Stay up to dateRobert is happy to keep you informed of new informationas it becomes available, and as updates are made here. So consider registering to receive updated news and information.
DisclaimerRobert is not qualified to provide financial advice, and does not hold a Financial Services License. Any charts and comments here are purely personal observations of the market. They are of a general nature, and for general education only. There is no advice. It is recommended that you do NOT make any investment decisions based on any of the information here. |


