More Information
eBook Articles - Share Market Toolbox Members
can see more details in the following eBook Articles:
(Toolbox non-Members can see the "Page 1" of these Articles
from the Master List page.)
Robert writes information from time to time about
the market and investing. If you are not a Toolbox
Member, you can register to receive
useful free information as it is published.
Privacy ensured, unsubscribe anytime.
See
the Testimonials - the things that people say
about the Toolbox and more.
|
Terminology
Any special terms that might be used in the text at left,
can probably be found discussed in the Toolbox somewhere.
Perhaps in Brainy's eBook Articles - see the Master Index list for details.
Or, search
the eBook Articles.
The Share Market - more information
about
the market and investing and trading.

The toolbox is an arsenal of weapons to help you tackle the
share market.
See a list of contents on
the Toolbox
Gateway page.
Robert Brain provides
various support to both
new and experienced traders and investors.
Who is Robert Brain?

And whatever you do,
beware of the sharks in the ocean!
|
Stan Weinstein
Stan Weinstein published one really good text book in 1988, Secrets for Profiting in Bull and Bear
Markets, and in it he promoted a number of key
strategies and concepts.
30-week Moving Average (MA)
on a Weekly price chart
This is one of Weinstein's key principles. In the weekly chart
of the XAO above, the blue curve is the 30-week Moving Average (MA).
For as long as the price stays above the 30-week MA, and
the MA line is heading upwards, Stan says the index (or stock)
is rising. But if price crosses below the MA and the MA
flattens and heads down, then there could be rough times ahead and
it is time to sell. For example, in January 2008 and late April
2010.
Stage Analysis
The coloured ribbon across the bottom of the above chart is
Weinstein's Stage Analysis ribbon (as applied in BullCharts
charting software).
Weinstein said that at any one point in time, a stock (or an index)
will be in one of four market "stages":
- Stage 1 the Basing Area (also known as consolidation or
accumulation phase)
- Stage 2 the Advancing Stage
- Stage 3 the Top Area (also known as the distribution phase),
or
- Stage 4 the Declining Stage.
For more information about Stage Analysis, see Brainy's eBook (PDF)
Article
ST-6410, "Sample trading strategies - Weinstein"
(Toolbox Member password required), and you can refer to Weinstein's
book, "Secrets
for profiting in Bull and Bear Markets".
There is a great 6-minute interview with Stan Weinstein on YouTube
regarding his Stage Analysis. See the video on YouTube here (you might need
to persevere with or skip, some ads).
Simple MA or Weighted MA?
There is often discussion about whether Stan used a Simple, or a
Weighted, Moving Average. Here are some notes with reference to his
book.
- Page 13: "...Over the
years, I've found that a 30-week moving average (MA) is the
best one for long-term investors, while the 10-week MA is best
for traders to use. A 30-week MA is simly the closing price
for this Friday night added to the prior 29 Friday weekly
closings. Divide that figure by 30 and the answer is what's
plotted on this week's chart...".
- Page 25: "...Mansfield
charts do not give a simple 30-week MA where all 30 weeks
count equally. Instead, they use a weighted 30-week MA where
by the most recent action counts far more than the old input.
This makes the MA more sensitive to current activity and helps
it reverse direction faster. The drawback to their weighted
average is that it leads to a few more whipsaws..."
 Page
313
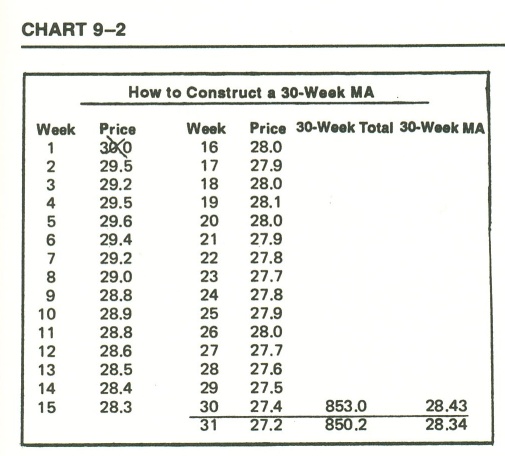
includes the diagram labelled Chart 9-2 (shown at right), and
provides a detailed explanation of how to easily calculate a
30-week simple moving average (without a calculator or computer)
as follows: Page
313
includes the diagram labelled Chart 9-2 (shown at right), and
provides a detailed explanation of how to easily calculate a
30-week simple moving average (without a calculator or computer)
as follows:
"To get the first plot for
your 30-week MA, simply add up the 30 weeks on your calculator
or computer and get the total (853). Put that answer in the
total column. Then divide by 30 and you have your starting
point for the MA (28.43). In the following weeks, there is no
need to repeat the lengthy process of adding up the new 30
weeks. Simply add the 31st week (27.2) to last week's total,
then subtract out the oldest week (the oldest week's total in
this case is 30.0 - remember to cross it out on your data
sheet...".
Acknowledgement:- The text and table above are from Weinstein's
book.
Readers are encouraged to study further details in his book,
"Secrets
for profiting in Bull and Bear Markets" (McGraw-Hill,
1988) available from good book shops, including the Educated
Investor financial bookshop:- www.educatedinvestor.com.au
Note also that a 30-week WMA appears somewhat similar to a 20-week
or 21-week EMA.
It is also interesting to understand that Weinstein developed and
tested his approach over a long period of time, and when computers
were only scarcely available. And the computers that he might have
had ready access to were probably the text-based version (the first
incarnation of Windows was available in late 1985 with only a
limited range of software available).
Current Analysis
Robert analyses the Australian market on a weekly basis, and
includes a weekly update of this type of chart.
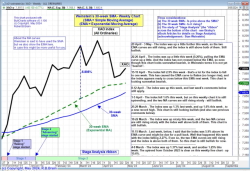
The small chart at right is a tiny version of the latest
analysis. Toolbox Members can see details and comments in
the latest chart in the Toolbox
Member's Area, or click on the chart at right to view
a large version of the latest analysis. |

|
More information?
For more details see the Share Market Toolbox links at the top of
the column at right.
|
This is one of the many tools in Brainy's Share
Market Toolbox.
The information presented herein represents the
opinions of the web page content owner, and
are not recommendations or endorsements of any product, method,
strategy, etc.
For financial advice, a professional and licensed financial
advisor should be engaged.
Home | DISCLAIMER | Contact
us
© Copyright 2012-2022, R.B.Brain -
Consulting (ABN: 52 791 744 975).
Last revised: 2 May, 2022
|


