|
Brainy's
Share Market Toolbox (public information) |
When the market is falling, as in a raging
bear market,
The answer might
surpise you. Read on... |
|||||||||||||
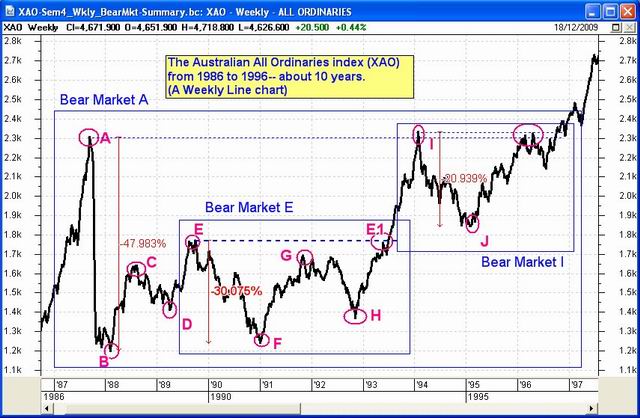
IntroductionWe know that market corrections and bear markets come around fairly frequently - at least once every 3 years - and their effects can last for many months or even years. Not convinced about that for starters? See the details about market corrections and bear markets. "When the
market falls, I hold onto my stocks for the dividends.
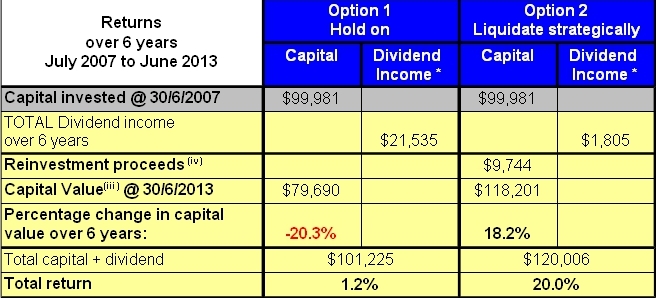
Not only that, the statistics show that a bear market or a correction comes around at least every three years. If only we can spot these early and avoid them - and we can! Despite what the industry experts tell us, we can "time the market". So, if we sense that a bear market is unfolding, should we hold on to our stocks because of the dividends? Or should we opportunistically sell the stocks that come under pressure, and do something more useful with the cash? In this study, opportunistic selling of stocks did protect the capital. One of the two alternatives in this study suggests that holding on to the stocks, and taking the dividends, can result in a long-term destruction of capital. While selling using a sensible exit strategy can result in both protecting the capital, and reaping further capital gains utilising alternative investment options. Executive summaryThe findings from this study are summarised in the following table, with further discussion included below. Notice that after a 6 year period, the buy-and-hold investor realised a total return on their investment (capital plus dividend) of a measly 1.2 percent, including more than $21,000 in dividend income. On the other hand, the strategic seller realised a total return of 20 percent.
The study - OverviewWe did a study in late 2010, based on the three year period from July 2007 to June 2010, and included the results in a presentation "Blue Chip Price Charts - Unlocking the Secrets" delivered to a number of groups. This study constructed a representative $100,000 portfolio of ten blue chip stocks for the 3-year period July 2007 to June 2010. In July 2013 the results were then updated for a further three year period until June 2013. A list of the stocks and their performance are included below. Two alternative investment approaches were considered:
In Option 1, the capital value 6 years later was reduced by more than 20 percent. Dividend proceeds totalled more than $21,000 as shown in the table above. The capital loss over the period was 20 percent, but the total simple return of capital plus dividends over the 6 years was 1.2 percent (due to the dividend income). In Option 2, all stocks were progressively sold in the months up to 31 December 2008. Dividends were collected whilst the stocks were held. On 1st January 2009 the cash was invested in the equivalent of a cash/bonds managed fund which was returning around 3 percent pa. The total return over the 6 years was 20 percent. ConclusionThe overall conclusion from this study is that based on this selection of ten blue chip stocks, with an initial shareholding of about $10,000 worth of shares in each of the 10 stocks for a total portfolio value of $100,000, that a long term investor following the buy-and-hold strategy would have seen a reduction in capital value over at least 6 years. And after factoring in the dividend income the total return is only marginally better than the original starting position. On the other hand, an investor utilising a strategic exit strategy could have protected the capital, and in fact seen a reasonable total return over the period. Some more information about this study is included below, with important details only available for Share Market Toolbox members. |
More informationMore information specifically relevant to this topic can be found in:
 More details on the topics mentioned here can be found in Brainy's eBook (PDF) articles, and in other web pages in the Toolbox (some of which are reserved for Toolbox members). See the Toolbox Master Index for details.

The toolbox is an arsenal of weapons to help you tackle the share market. See a list of contents on the Toolbox Gateway page. Robert Brain provides various support to both new and experienced traders and investors. Who is Robert Brain?  And whatever you do,
beware of the sharks in the ocean! |
||||||||||||
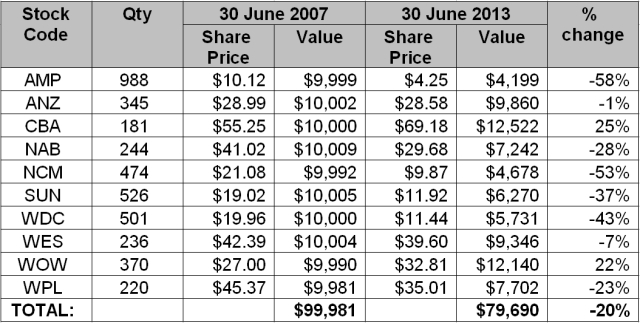
The study - basic detailsThe study was conducted in two parts. Part 1 took place in late 2010, and considered the performance of ten stocks in the 3 year period from July 2007 to Juine 2010. The results were shared in presentations (mentioned above). The study was updated three years later in July 2013 for the perfornance over the extra three year period, for a total of six years.Which stocks? and the share price performanceFor this study, ten so-called blue chip stocks were selected from the 20 stocks in the S&P/ASX 20 index (ASX code:XTL). The stocks and their share price movements over the six years in question are shown in the share price performance table below. Which stocks are in the XTL index? - See the list...
Option 1 - Buy and holdThe first option in this study simply involves holding on to the selected stocks throughout the period, regardless of the market performance, and regardless of the individual performance of each stock. After all, these stocks are considered blue chips, and market experts continue to advise that blue chip stocks ought to form the core of an investor's portfolio. [But in this author's opinion, blue chip stocks can disappoint.]Option 2 - Strategic and opportunistic selling
There is also some information about Weinstein's approach in the public technical analysis section of the Share Market Toolbox, and more details in Weinstein's book "Secrets for Profiting in Bull and Bear Markets". The exit strategy used here is not the best strategy for this, and is by no means the most profitable; but it is a simple and basic approach that can be readily followed. And it was a useful approach for demonstration purposes in this study. During the first 18 months of the study, implementation of the exit strategy resulted in all ten stocks being progressively sold. The study ignores any possible reinvestment of these funds until after December 2008, at which time the funds are invested into a plain cash/bond managed fund (details in the Share Market Toolbox for members.) For more details about this study, and exactly when these stocks were sold and for how much, see the Toolbox members details. Subsequent dividend and portfolio performanceFor details regarding the dividend and portfolio
performance in subsequent periods, see the Share Market Toolbox members area. More information?More
information about this study is included (for Toolbox Members) in eBook (PDF)
Article ST-6050, "Keep for dividends?". |
|||||||||||||
|
The information presented herein
represents the
opinions of the web page content owner, and ©
Copyright 2013, R.B.Brain -
Consulting (ABN: 52 791 744 975).
|
|||||||||||||


