 |
BullCharts - What's new? |
|
What's new in BullCharts version 4.0?
You are here: Share Market Toolbox >
BullCharts >
What's new in v4.0?
Related pages: Software Features, Getting Started - Intro, Getting Started - Next Steps,
KnowledgeBase, FAQs, User Groups, TradeSim (for backtesting)
Related pages: Software Features, Getting Started - Intro, Getting Started - Next Steps,
KnowledgeBase, FAQs, User Groups, TradeSim (for backtesting)
BullCharts version 4 (July 2014)
There are a number of documents and videos to help explain the key features and enhancements that are included in the version 4.0 upgrade of BullCharts:
- The What's New in Version 4 PDF document (27 pages), or see the 2-page summary.
- A set of powerpoint slides that are used with presentations.
- Several short videos that explain the features in more detail (see the links below).
The key features and enhancements in Version 4 include the following, some of which are supported by short explanatory videos as indicated:
Introduction to Version 4.0
- See the video on Vimeo (2m 25s).
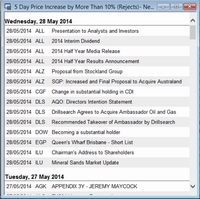 The NewsWatch report |
 The Detailed Watchlist |
Enhancements to watchlists
- Coloured watchlist entries (in earlier version)
- Use new hot-key to quickly apply colour
- Sort on "Comment" field
- NewsWatch report - a list of recent news for all stocks in a watchlist. See screen shot at right.
- Detailed Watchlist - a list of price data for all stocks in a watchlist - can sort the list by "today's price movement percentage". Screen and columns - customisable. For End of Day data users, or live data users see refreshing data. See screen shot at right.
- See the video on Vimeo (8 mins).
See sample screen shots at right.
Click on one for a larger version.
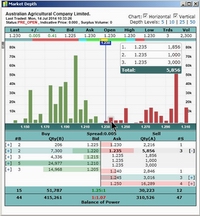 Market Depth - dynamic bars |
Dynamic market depth bar charts
- Vertical and horizontal bars to
graphically indicate amount of volume at each price point
(dynamic for live data
users).
- (video coming soon)
- Also see a 4-minute video of the Australian market 4pm match-out in progress, show-casing the dynamic bars in the BullCharts market depth and the indicative price. See the video on Vimeo (4 minutes).
See sample screen shot at right.
Click for a larger version.
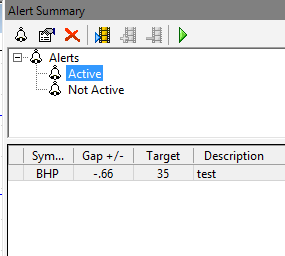 The Alerts Summary |
Changes to alerts (on price and volume)
- Display "Comments" column in the Alert Summary window.
- Continue to use BullCharts while the Alert Scan is
running.
- See the video on Vimeo (4 mins).
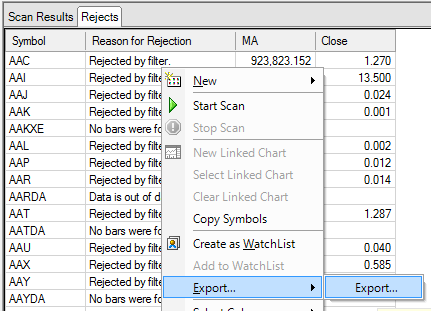 The Rejects Table |
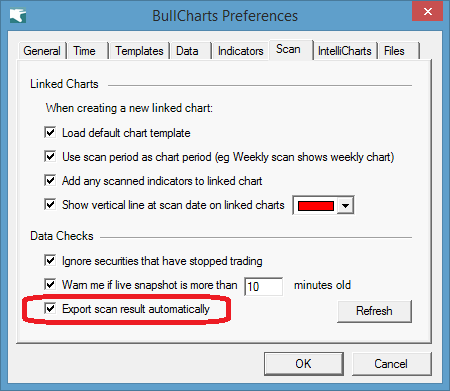 Auto-Export Results Table |
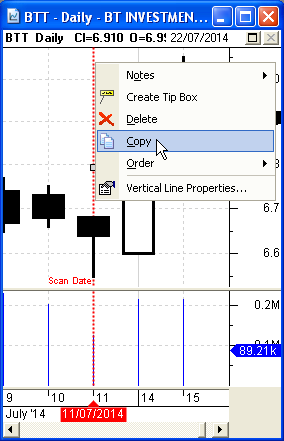 Copy Scan Date |
BullScan enhancements
- On the "Scan Results Table" view, the "Rejects" tab
now includes more data
(eg. to assist with debugging a new scan).
- On the Rejects tab, can right-click for drop-down
menu action items (eg. copy symbols, export, etc.)
- Automatically export scan results to a CSV file.
- On the price chart, copy the "Scan Date" vertical
line to another chart pane.
- See the video on Vimeo (4mins 40s).
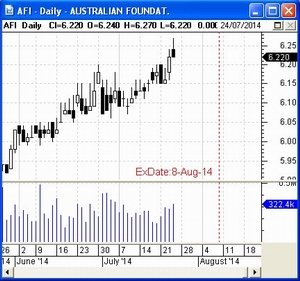 Ex-Dividend Date - vertical line |
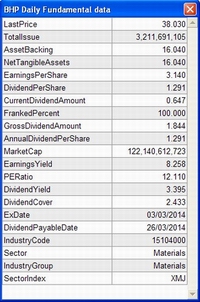 Fundamental Data report |
New and updated chart indicators
- Ex-Dividend Date vertical line (implemented as a
chart indicator). See screen shot at right.
- Indicator ribbon height is adjustable.
- Save default settings for indicator Markers.
- Automatically replace date in indicator using cursor
date.
- Heikin Ashi revisions.
- Double Tops and Bottoms indicator.
- Ichimoku indicator (is now accurate)
- Fundamental Data report (implemented as a chart
indicator). See screen shot at right.
- (video coming soon).
See sample screen shots at right.
Click on one for a larger version.
BullScript enhancements
- Candlemode linestyle (controlling candle colours)
- Report window and report attributes
- Fundamental Report - the attributes
- New Indicator Markers in BullScript.
- (video coming soon).
Many tweaks and general improvements
- Many more little things (too many to mention here)
More information
- How to get started
with BullCharts - Some tips, information sheets, and short tutorial
videos, in the free section of my Share Market
Toolbox.
- General features list
-
Watchlists, lists of stocks in
each index, easy price charts, customisable chart templates, many
indicators to choose from, easily-customisable scans and Author
Strategies already implemented. Developed using start-of-the-art
software tools and systems, but simple to use. See more
details here.
- You still have some questions?
- Visit the User Group, or give Robert
a call to discuss.
