 |
BullCharts - Getting Started #2Watchlists, Chart layout, Time periods |
 |
Also see the basic Getting Started - Introduction to BullCharts.
Here is a useful list of the Next Steps to
help you get going with using BullCharts.
You are here: Share Market Toolbox >
BullCharts >
BullCharts
Getting Started #2 - Watchlists, Chart layout, Time periods
Related pages: Getting Started #2 - Watchlists, Chart layout, time periods,
Getting Started #3 - Scans (market filters),
Getting Started #4 - Indicators, Templates, Workspaces,
Getting Started #5 - More about indicators and BullScript,
Getting Started #6 - How to use BullCharts,
BullCharts KnowledgeBase,
Software Features, FAQs, User Groups, TradeSim (for backtesting), Not Convinced?, BullCharts webinars;
Next Steps
(Any items marked "BC-xx-yyy" are some of Robert's pdf Articles in the public area of the Share Market Toolbox, some of which are free, and others are available only to Share Market Toolbox Members).- Watchlists -
Set up and manage one (or more) watchlists to record your list(s) of favourite stocks, and any current holdings. See Robert's BullCharts KnowledgeBase. Note key points: 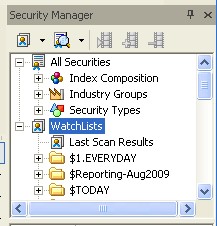 The Security Manager
(in the Control Panel), already includes various lists of all stocks on the Australian market (grouped by index, or sector). It also includes the Watchlist facility.- Two lists of stocks
You might have two lists of stocks that you want to follow - your current holdings (portfolio), and a list of favourite stocks to watch. So, create two Watchlists (or many). - Many lists of stocks
You might have many lists of stocks to monitor - you can create one or more "folders" and have one or more Watchlists within each Watchlist Folder.
- The chart layout -
Set up your preferred price chart layout for your "default" chart and save it as a BullCharts Template. What is a Template? How does this work? See Getting Started #4 for more details.
- Different time periods - (Daily,
Weekly, Monthly)
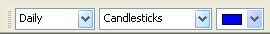 Note how quick and easy it is
to switch a chart from one time period to another using the drop-down
options in the Chart Style toolbar.
Note how quick and easy it is
to switch a chart from one time period to another using the drop-down
options in the Chart Style toolbar.
If you want to have, say, two charts open - one Daily and one Weekly - you can have multiple price charts on the one screen. See the Multiple Price Charts item in Robert's BullCharts KnowledgeBase, especially the link to Tip Sheet 18.
- Float a window
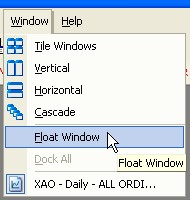 If you have more than
one computer monitor and you want to put a price chart over onto the
other monitor, use the Float Window menu option. Note the other options
on this Window menu item, to "Tile" multiple price charts on the screen.
If you have more than
one computer monitor and you want to put a price chart over onto the
other monitor, use the Float Window menu option. Note the other options
on this Window menu item, to "Tile" multiple price charts on the screen.
- Scans -
Setting up a scan and specifying your selection criteria to search through a list of stocks to find those that meet your selection criteria. See the Introduction to Scans (6 minute YouTube video).
Each scan is defined in a separate disk file outside the BullCharts system. Existing scans can be easily customised, or new ones created, or someone else's custom scan can be downloaded and saved.
See How To Download and Save a Custom Scan (8 min video).
Also note the Articles in Robert's BullCharts KnowledgeBase.
See more on scans on the next "Next Steps" web page...
The Next Steps?
See Getting Started page #3 - Scans and market filters.Note: Some of Brainy's Articles that might be listed above are publicly available, but many are only available to Toolbox Members.
Also see:
- Robert's BullCharts
 video Channel for a list of all
videos.
video Channel for a list of all
videos.
- BullCharts FAQs (Frequently Asked Questions).
- Arrange a Free software Trial?
If you don't yet have BullCharts,
we can arrange a free 2-week trial
of the software.
Contact Robert to arrange this. - User Group information (FAQs, the
Yahoo Forum, etc.).
- Robert's BullCharts
KnowledgeBase.
- Robert's full collection of eBook
(pdf) Articles on BullCharts (and Share Trading and Technical
Analysis).
- Robert's Seminars on the Share Market,
Charting, and BullCharts.
- The official BullCharts web site - www.bullcharts.com.au
- The BullCharts Users' Forum
www.bullcharts.com.au/Forum/
- Robert is a qualified and authorised BullCharts reseller, running the BullCharts User Group, and offering help and support to BullCharts users.