Why does Robert use
BullCharts?.")
Robert uses the Australian BullCharts software for
a
whole lot of reasons. All the features listed below add up to a great
software package.
General information
Key software features for you to
leverage:
The following tips will help you to leverage the power and flexibility
of the BullCharts package (with more details of these features below):
 Company
news and announcements - These are made available from the
ASX web site (as PDF documents), and also in BullCharts from the menu
item: Company
news and announcements - These are made available from the
ASX web site (as PDF documents), and also in BullCharts from the menu
item:
Actions > News > Quick News Search, or
using the "Quick News Search" toolbar button (see image at right). See more details and sample below.- Watchlists -
Very easy to create
and maintain multiple watchlists. Have one
Watchlist of your favourite
stocks to watch, and one of stocks currently invested, and one for each
sector or category of stocks you are following (eg. your favourite
mining stocks, or biotech stocks, or banks, etc.). Have many more if
you want (and group them into folders) - more on watchlists below.
- Slideshow
- Quickly and easily view a price chart of each stock in one of your
watchlists - more details below.
- Hot
stock? - In the watchlist list of stocks, flag a stock by
applying a colour background to the watchlist entry - see sample below.
- Technical chart indicators -
Many
indicators are built-in - simply use your favourite ones and ignore all
the rest. Add your favourite indicators to the Indicator Toolbar to
make it very
quick and easy to apply them to a chart - more on indicators below, and
at right.
- Templates -
Save the "layout" of
your preferred chart for quick application again later, and add your
favourite layout to the template toolbar. Create
several different templates - perhaps one for daily, one for weekly,
one for monthly. Or perhaps one with a trend indicator included, and
another with a momentum indicator - more
on templates below.
- Annotations
on the chart? - Quickly apply text, or trend lines, or
Fibonacci tools, or other line
studies, etc. to a price chart, and save them for later
viewing - using the IntelliCharts
feature, or use the "File>Save" option to save the chart - more on IntelliCharts below.
- Quickly
save comments for a stock - Use the Comments field in
the Watchlist entries, or use the Chart
Memo feature - more on Chart
Memo below.
- Workspaces
- If you like to view two or three price charts on the screen, arranged
in a particular layout, then save the layout as a Workspace. Then use
the Workspace Manager to quickly apply one of your favourite Workspaces
- more on Workspaces below.
- Multiple
monitors? - It's easy to "Float" a price chart to another
monitor, and then save the total layout as a Workspace.
- Market scans - Easily create
or
customise a scan, specifying your own selection criteria, and
automatically scan your preferred list(s) of stocks to produce
a short list of the stocks that match your selection criteria today.
Easily arrange your favourite scans using the Category or Author groupings - more on scans below.
- Author Strategies
- We have done
the hard work for you. Many stock selection strategies are already
supplied as market scans, as well as the indicators that are used by
many famous traders, analysts and book authors. These are referred to
as Author Strategies - more
on Author Strategies below.
|
Technical
software features
- From version 4.2, using the open source SQL database
for multiple markets data storage.
- Up until version 4.1, using the latest Microsoft .NET
application
development architecture and technology.
- Up until version 4.1, using the secure and
corporate-strength Microsoft SQL
server database technology to store security data on your local
computer.
More details of
BullCharts software features
in the list below.
|
|
More information
Also see Robert's "Pink
Information Sheet" for a 2-page summary list of features.
For more information about some of the keywords used here, refer to the
items in Robert's BullCharts
KnowledgeBase.
|
These are just some of the indicators already included in the
BullCharts software. It is a long list, so you should identify a couple
of useful ones, and stick with them and ignore the rest.
More common indicators:
- Accumulation / Distribution
- Advance Decline
- ADX / DMI
- Bollinger Bands
- Candle Patterns
- Chaikin's Money Flow
- Coppock
- Directional Movement (DMI)
- Guppy MMA
- Heikin Ashi
- Hull MMA
- Hull's ROAR
- Hull's Range+
- JB Trailing Stop
- JB Profit Taker
- Momentum
- Moving Average (MA)
- Moving Average Cross-over
- MACD
- On Balance Volume (OBV)
- Parabolic-SAR
- RSI (Relative Strength Index)
- RSC (Relative Strength Comparison)
- Stochastic
- Wilson ATR Trailing Stop
- Weinstein's Stage Analysis
Additional indicators:
- Chandelier Exit
- Commodity Channel Index
- Darvas Box
- DiNapoli (various)
- Donchian Channel
- Elder Ray
- Envelopes
- Force Index
- Ichimoku
- Money Flow Index
- Price Oscillator
- QStick
- R-Squared
- SIROC
- TAM (Time And Money)
- TD DeMarker
- TEMA
- Trading Bands (like envelopes)
- TRIX
- Typical Price
- Volatility
- Wilder's Volatility
- Wilson (various)
|
|
BullCharts
software features list
- Charting tools are
great:
- Easily apply trend lines, text notes,
circles,
arrows, Fibonacci Retracement or Extension, price
change ruler, and
many more.
- IntelliCharts -
will
automatically remember the text, chart tools and indicators that you
apply to a particular stock (can be easily turned off).
- Chart Memo - use this
feature to
record notes about a stock.
- Save the chart and all its features as a disk
file
for later retrieval.
- Line
studies
- Over 50
built in tools, including squares, circles, line segments, arcs, fans,
Fibonacci tools, Gann tools, Andrews Pitchfork, Count Back Line, Trend
Ruler, etc., etc.
- Chart types
- Common chart types - OHLC
Bars, Candlesticks, Line, Point & Figure.
- More chart types included: Gann Swing, Kagi,
Renko, Three line Break, Equivolume, Candlevolume, Stepped, Points,
Pretzel.
- Semi-log chart - apply log scale to vertical
price
axis.
|
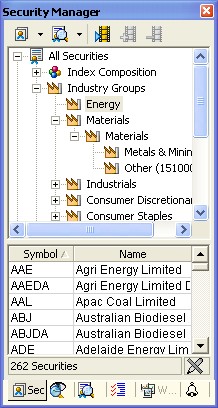 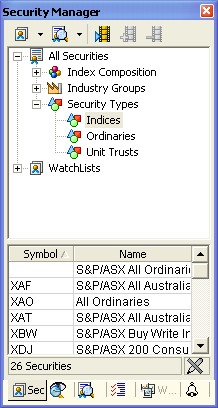 Security Manager includes index
listings Security Manager includes index
listings
- The
Security Manager
feature includes:
- a list of all major indices (see at right)
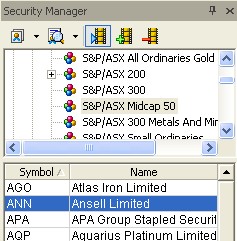
- pre-loaded lists of all the stocks in the
major indexes,
and
- pre-loaded lists of all stocks within GICS
sectors (see the screen shot sample at far right for the Energy sector).
|
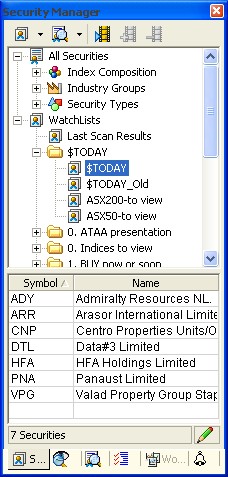
- Easy to create one or more watchlists,
and to
keep the watchlists in specific
folders or sub-folders (see sample at right).
- A watchlist might be a list
of
stocks that you
are following and which are possible candidates for investment, or it
might be your current share holding(s).
- Easily add one, or many, stocks to a
watchlist.
Easily copy all stocks from one index or sub-index into a watchlist.
- Lots of watchlists? Easily organise
them into
Watchlist Folders.
- Slideshow
-
View a
chart
of each stock in a watchlist using the Slideshow feature (see screen
shot below). Click to
start the slideshow, and step back and watch. Going too fast or slow? -
simply click on the button to speed up, or to slow down. These buttons
are across the top of the Security Manager window pane (in the screen
shot below).
|
|
|
|
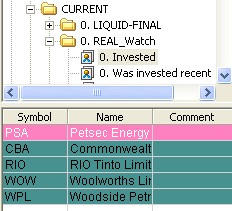
- Apply
colours - Apply colours to stock entries in a watchlist,
and then sort
the watchlist entries by colour, or symbol, or name.
|
 |
|
- Company
news and announcements
This
includes a whole range of information that the company
announces to the market which is
available from the ASX web site.
In BullCharts, use the "Quick News Search" toolbar button - see the
screen shot at right, and click on the image for a larger version in a
new window.
Or use the menu option:
Actions > News > Quick News Search.
|
 |
|
- Chart
Indicators
- Lots - more
than 270 (see
list above right).
- Use the few that you like, and ignore the
rest, or
experiment with different ones.
- Templates
- A template is the look and appearance of a
single
price chart (the style of the chart).
- Store several different templates (chart
styles).
- Customise the Template Toolbar by adding your
own
templates, and removing the standard ones.
- Scans
are easy
- Create and run a special set of selection
criteria and search through a selected group of stocks to find those
that match your criteria. The resulting list of stocks is
available for you to research further for share purchase consideration.
- Many scans are already supplied
with the software (more than 100), including some Author Strategy
scans.
- Scans are very easy to modify,
or create your own. Use drop-down boxes and selection lists
- no programming required. Much easier to use than
competitive products - without mentioning any names.
- Can use
scripting tool for serious customisation if desired.
- Price
(and Volume) Alerts
- This feature was added in v3.8.
- Set alerts on price or volume.
- Set alerts on any of the Close, Open, High or
Low
price values for the period.
- On a price chart, just click on the Alert
toolbar button, then click on the price chart at the price point where
you want to set the alert. Then you automatically run an Alert Scan
either End Of
Day, or after a Snapshot download, and a list of triggered alerts is
displayed. (For more information about the snapshot plan see the BullCharts FAQ.)
- Alert Trend
Lines
- New in version 3.9.
- Drop a sloping Alert Line onto the chart -
either
on the price pane or the volume pane.
- Set BullCharts to alert you when the price
(or the
volume) rises above the line (or falls below it).
- BullScript
- If you have
very
unique or special requirements, you
can use the supplied programming language (BullScript scripting tool)
to seriously customise Scans or Indicators, or to write your own.
- Author
Strategies
- The
trading strategies of many famous traders and authors are implemented
in Scans,
Indicators, and chart tools. Referred to as Author Strategies.
- Back-testing
- Back-testing features are
available using TradeSim software (from
CompuVision Australia Pty. Ltd.) with good integration with
BullCharts.
- Or you can run the scans "as at" a prior date.
|
|
|
- Zoom in and out on
the
price chart is easy (with toolbar button, or the mouse wheel).
- Extend or collapse the
vertical
price scale (by dragging the axis).
- Layer
Manager
- If you have a number of drawn elements on a
price
chart (eg. text,
lines, indicators, etc.), use the Layer Manager to temporarily "hide"
some or all of these items in order to study some aspects of the price
chart better.
- Workspace
Manager
- Feature
added
with
version 3.8 to help manage a number of WorkSpaces (a WorkSpace is the
on-screen appearance and layout of multiple price charts, including
across multiple display monitors).
- Portfolio
Manager - Included with
version 3.8.7
- Trade
Planner - to help you work
out your likely Reward:Risk Ratio, or optimum position size, or other
trade parameters (new in version 3.8.7).
- Data plans
- End of Day data plan - is
the
most common, and gives a data download and update after 7:30pm each
trading day.
- Snapshot plan - Download a
snapshot of the share prices on the hour (but download 20 minutes after
the hour to avoid extra ASX royalty payments). For more information
about the snapshot plan see the BullCharts FAQ.
- Dynamic Live data -
display
intra-day chart with live data streaming over the web to update the
chart in real time. Can show data intervals of 1, 2, 5, 14, 30, 60,
120 minute intervals, with real-time live updating as trades take place.
|
|
|
|
|


.")