
|
Brainy's
Share Market Toolbox (public information) |
 |
Optimising position size
|
 |
When investing (or trading) in the
share
market,
|
| You are here:
Share Market Toolbox
>
Share Market
> Optimising
position size Related links: Robert's Philosophy; Share Market GEMs; Share-Market-Ready; Paper Trading; Market Indexes; Risk management; Exit strategies; Stop Loss; Support and Resistance; Trend-spotting; Funda-Technical Analysis; Sensible Investing; Contrarian Investing Redefined; Technical Analysis; |
IntroductionNew investors to the market often struggle with the above questions. Included below are some really useful considerations to help guide the investor or trader with the answers. At first, many new share market investors like to get just a small taste for the markets by investing only a small amount - maybe $500 or $1000. There are a few things they don't realise about this. Firstly, a small parcel size like this will be decimated by the brokerage fees, and perhaps impacted further by slippage. The share price would need to rise substantially before being able to sell for a profit. There is a minimum parcel size that's needed so as to minimise the effects of brokerage costs. Secondly, many investors have enough money available to be able to fund a reasonable share purchase; but they allocate the same amount of money to each of several positions. It might be a simple $4,000, for example, or $5,000, or $10,000 per position. What they don't realise is that it is possible to optimise the position size and make the investment capital work as harder, and produce better returns. It can be very beneficial to
consider the “optimum” Risk managementWhen considering the parcel size, it is important to consider basic and sensible risk management, including the "proportion of capital" risk management rule. This is another consideration in addition to the other ideas discussed below. With this particular rule, many people make sure that no more than 20 percent of their total investment capital is allocated to any one position - just in case something happens to that particular company (perhaps unlikely, but worth considering). See more information about risk management. Position size - Two popular approachesThere are two popular approaches to position sizing. As mentioned above, many investors allocate a fixed dollar amount to every position. This approach is, logically, referred to as the Fixed Dollar Amount per Trade approach. Another common method which can optimise the position size for better returns is the Fixed Risk per Trade approach. Both of these are discussed below. (a) Fixed Dollar Amount per TradeMany investors simply allocate the same amount of money to each position in the market, probably because they aren't aware of any technique for calculating a different amount. There is not much wrong with this method, and it can be successful and profitable. However, it's possible to be more profitable by optimising the position size using the Fixed Risk per Trade method described below. Many investors simply follow the simple approach of allocating a round $5,000 or $10,000, for example, to a share market position. Without realising that the application of some simple risk management methods can both reassure the investor that the risk is acceptable, and indicate that higher position size might be feasible at no greater risk; but with the possibility of increased profits. (b) Fixed Risk per TradeThe idea of having a fixed amount of "risk" per trade achieves two things. Firstly, by using a risk percentage amount that we are comfortable with, we know that we can sleep soundly at night. Even if the price falls overnight, it won't devastate our investment capital. Secondly, we identify a lower price level at which we will sell the position if the price were to fall that far. And this price level can be readily deduced based on the past price action (knowing that the opinions and emotions of the market participants are shown in the price charts - that's what technical analysis is all about). More details about this approach are included below. Position size calculatorsThe key input values that are often used in a position size calculator include:
These days, the easiest way to calculate a position size using input values such as these is either a spreadsheet tool that you can customise and fine tune, or a supplied calculator tool to run on the computer. Some of the good charting software packages include good position size calculators. See more details about the "Risk Amount" position size calculators below. More informationSee the detailed discussion about the Fixed Risk per Trade below, and more information on this and related topics, see in the column above right... |
More InformationInformation in this Share Market Toolbox:
 Brainy's
Position
Size Calculator spreadsheet (including brief notes). Brainy's
Position
Size Calculator spreadsheet (including brief notes). Brainy's eBook (PDF) Article ST-4400, "Position Size + Calculator" - describes how to use the Position Size Calculator in detail. The BullCharts charting software includes a position size tool in it's Trade Planner tool - see a 6-minute video on how to use it - listed in Robert's BullCharts Knowledgebase. Wanting to utilise technical analysis to study the historical prices in order to take advantage of rising trends? See more information about Technical Analysis. Also...
The Share Market - more information about the market and investing and trading. 
The toolbox is an arsenal of weapons to help you tackle the share market. See a list of contents on the Toolbox Gateway page. Robert Brain provides various support to both new and experienced traders and investors. Who is Robert Brain?  And whatever you do,
beware of the sharks in the ocean! |
||||||||||
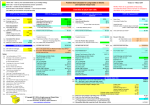
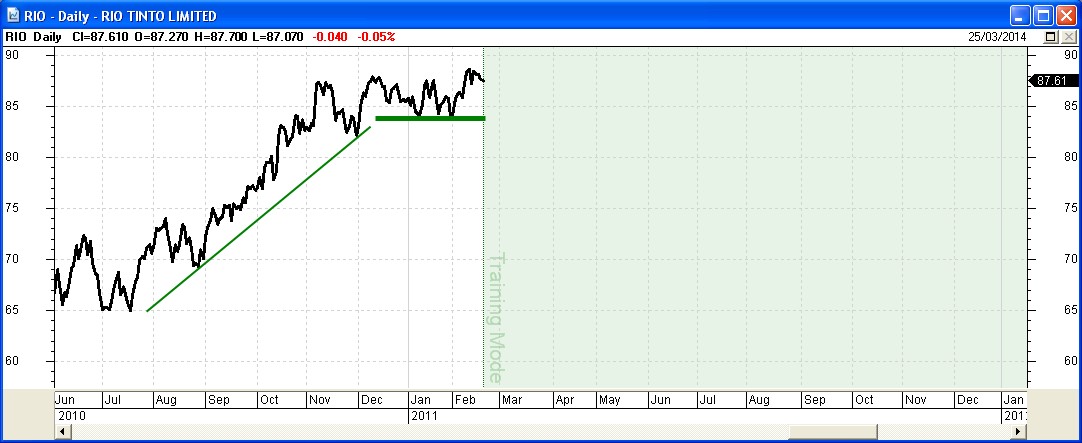
Fixed Risk per Trade - detailsBefore studying this position sizing approach in some detail, it is very useful to have a quick look at the usefulness of the Stop Loss approach. Stop Loss example
Fixed Risk per trade position sizingUsing the example of Rio Tinto above, let's look at the possible purchase of Rio shares in February 2011, and noting that a Stop Loss of about $83 would have been a good idea. If we wanted to purchase on a break to a new high above $88, with a Stop Loss at $83, and if the price had have fallen below $83 and we sold the parcel, then the loss would have been $5 per share. (For simplicity here this assumes the ideal situation that of a purchase at $88, and a sale at $83, whereas in reality, a purchase on a breakout above resistance is often made at a higher price, and a sale on hitting the Stop Loss is often made below the Stop Loss price - these variances in the price are referred to as slippage). Using these numbers, the "risk per share" is $5. Now, if we are comfortable with the "Two Percent Rule", and assuming we had investment capital of $100,000, then we are saying that to put 2 percent of our capital "at risk", we are prepared to lose 2 percent of $100,000 = $2,000 on any one trade. So, if we risk $5 for each share, up to $2,000 in total, that equates to the number of shares in this parcel as: $2,000 / $5 = 400 shares. And further, to buy 40 shares at our intended buy price of $88 (or higher depending on the slippage), the position will cost about 40 x $88 = $3,520 plus brokerage. |
|||||||||||
Conclusion and summaryIt can be beneficial to determine a position size based on key criteria, and to not have the same position size for all positions. |
|||||||||||

This is one of the many tools in Brainy's Share Market Toolbox.
The information presented herein
represents the opinions of the web page content owner, and
are not recommendations or endorsements of any product, method,
strategy, etc.
For financial advice, a professional and licensed financial advisor
should be engaged.