Share Market Toolbox
(public information)

|
Brainy's Share Market Toolbox (public information) |
 |
Technical Analysis
|
 |
| Price
charts
summarise the underlying opinions and emotions of the market
participants. Every chart tells a story. It pays to understand the stories in the price charts. |
| You are here: Share
Market Toolbox > Technical Analysis
> Technical Analysis Getting Started Related links: Technical Analysis - What is it?; TA - The Proof; 4 Windows approach; Chart patterns; Dow Theory; Trends and trend-spotting; Support and Resistance; Stop Loss; Fundamental analysis; Funda-Technical Analysis; eBook Articles Master List; eBook Articles INDEX; about eBook Articles; |
|
How can you get started?
Okay, so you might be a little interested in learning some more about the art of charting, or technical analysis. And you want to know how to move forward? Understand the concept of trends
It is often said that "the trend is your friend".  Many successful investors
and traders simply look for a confirmed uptrend, and a temporary
weakness in price, then purchase to ride the trend until the trend
has finished. Many successful investors
and traders simply look for a confirmed uptrend, and a temporary
weakness in price, then purchase to ride the trend until the trend
has finished.Robert has devised an easy way to understand the concept of trends - the "3Ways Rule (in 3Times)". Also see this information on trends and trend-spotting. Understand the notions of
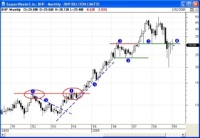
Support and Resistance  On
a price chart, it often happens that you can draw an imaginary
horizontal line across the chart and this line can represent either
a ceiling for prices (ie. a resistance level), or a floor for prices
(ie. a support level). On
a price chart, it often happens that you can draw an imaginary
horizontal line across the chart and this line can represent either
a ceiling for prices (ie. a resistance level), or a floor for prices
(ie. a support level).These support/resistance lines can be drawn at angles that are not just horizontal across the chart. Understanding how to to identify these levels, and how to correctly place these lines, can assist greatly in understanding where the future price action might move to. Appreciate candlestick charts
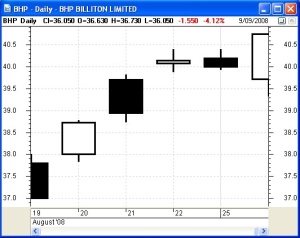
 Gain
an
appreciation of the usefulness of candlestick price charts which
show a lot more detail than the common line chart. Gain
an
appreciation of the usefulness of candlestick price charts which
show a lot more detail than the common line chart. See a basic introduction to candles here. Chart patterns
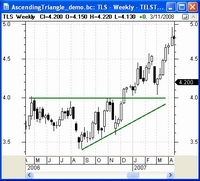
 Understand
that the way that markets behave, various patterns form on the price
charts. Understand
that the way that markets behave, various patterns form on the price
charts. This happens as the market participants engage in the buying and selling, and in the tug of war as they "argue" about their perceived value of any particular company's shares. See more about chart patterns. Chart indicators
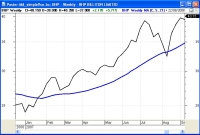
There are many chart indicators that can be placed on a price chart to help give some insight into the behaviour of the price. The most common of these is the Moving Average.  Indicators can be classified into three basic types - trend
indicators, volatility indicators and momentum indicators.
Indicators can be classified into three basic types - trend
indicators, volatility indicators and momentum indicators.See more details about chart indicators. You can use simple free web-based charting tools to do this, or a proper charting software package (Robert prefers the Australian BullCharts software). Choose a trend indicator
 Choose
one trend indicator, and learn what it is and how to use it. Choose
one trend indicator, and learn what it is and how to use it.
Some trend indicators include:
Choose a volatility indicator
Choose one volatility indicator, and learn what it is and how to use it. Some trend indicators include:
Choose a momentum indicator
Choose one momentum indicator, and learn what it is and how to use it. Some trend indicators include:
Understand the significance of Volume
The volume of a stock (or index) that is traded in any period is significant. That is, the actual number of shares that are bought/sold. One of the tenets of Dow Theory summarises this as: "trends are confirmed in volume". Robert recommends following the 4 Windows approach to analyse the markets, a stock, or index. This is to help remind us of the breadth of technical analysis, and also to serve as a checklist to help us remember key considerations for stock (and index) analysis. See the 4 Windows approach details... SUMMARY
The above comments can help provide you with some guidance as to what to focus on in your studying of technical analysis. However, successful investing or trading using technical analysis methods and techniques does involve a lot more than just this. Things like: appropriate emotional and psychological attitude; sound money management and risk management techniques; sound investment or trading plan and strategy; and back-testing and/or paper-trading. Good luck on your journey learning more about the art of technical analysis. CAUTION!!
We have to include a word of caution here. Technical Analysis is not 100% successful, nor 100% guaranteed. BUT! It will give you an edge in the market, and it is much better than not using it.
|
Technical Analysis - a definition
"The interpretation of past share prices on share price charts to try to gauge likely future price action." Robert's eBook (PDF) Articles
Robert has written a large number of eBook (PDF) Articles on Technical Analysis and other topics. Below is a list of the relevant Articles relating to the topics suggested at left. Note that the full Articles are available to Robert's Toolbox Members (and Premium Members). Non-Members can view the Page-1 of each Article. Price chart concepts and basics
Note: In the links below, the green background links are free, and the blue background links are in the Members Area of the Toolbox.
Trends
Support and Resistance
Chart indicators
Dow Theory
Money and Risk Management
 Beware the sharks in the ocean! |