Santa
Rally
- over recent years
(Toolbox
Members click on any charts for a larger version
in a new window) |
Observations
and
comments |
The Hirsch
Santa Rally
7 trading days
The last 5 days of one year, and
the first 2 of the new year. |
Weekly candle charts
Many of the charts in this column cover the
period August - February/March (8 months)
so it is easier to compare year to year
down the column. |
Additional charts
(time period may vary) |
2025
Santa Rally in 2025? Conclusion: There
was a small rally over the specific 7-day period, but the
index performed much better in the period from May to
October which is traditionally the period that
commentators refer to as the "Sell in May..." period.
9 January 2026 - We have now completed
the Hirsch Santa Rally 7-day period, and the XAO index was
up 0.38 per cent over those specific 7 days - so we could
say that a small Santa Rally did take place. Also, study
the first chart carefully and notice that the index rose
(by 1 per cent) on 23 December (day '1' of the 7-dayy
period), then drifted lower over the 5 numbered trading
days.
3 January 2026 - With one trading day to
go in the official Santa Rally period, there appears to
have been no rally this year. In the first chart at right
we can see a dip between the Christmas Day / New Year Day
period and the New Years Day holiday. The market
performance on the 5th January will be interesting.
19 December 2025 - What to expect this
year? What is in store for the Christmas period and
beyond?
|

The Yale Hirsch rally?
7 days (daily chart)
|

August 2024 - early January 2025
(weekly candle chart)
The index fell in Feb-March-April 2025, then suffered from
President Trump's Liberation Day. This was followed by a
strong rally in a peak in October., before a market fall
into November.
|
(longer term chart pending)
(weekly candle chart)
|
2024
Santa Rally in 2024?
May 2025 - The final chart at right shows
that the index rallied some more through January, then
fell heavily through February and March.
11 January 2025 - The updated first chart
at right shows the index continued the Christmas-time
rally and rose a little further. While the second chart
includes the latest weekly candle which is sitting at the
upper end of the range of the previous three candles -
indicating a rally over that period.
4 January 2025 - The first chart at right
shows the official Santa rally period for the XAO index,
where the index was up 2.35 per cent over the official 7
trading day period. So, we did see a Santa rally in 2024.
21 December 2024 - What to expect this
year? The market has already rallied some 7 per cent over
10 weeks from August 2024 until mid-October (see the
second chart at right). After a short 2-week retracement
it then rallied another 3.8 per cent into late November
before selling off in early December. What is in store for
the Christmas period and beyond?
|

The Yale Hirsch rally?
7 days (daily chart)
Here is what happened over the official
Santa Rally period.
The index was up 2.35 per cent.
|

August 2024 - early January 2025
(weekly candle chart)
The index was up 7 per cent over 10 weeks from August
2024, then another 3.8 per cent in November.
|

August 2024 - April 2025
(weekly candle chart)
After the official 7-day Santa rally period, the index
rose 3.3 per cent to a peak in early February, then fell
11 per cent in late March. Then Donald Trump's Liberation
Day struck, and created the long-tailed spike-low doji
candle in the first week of April, before rallying some
more. |
2023
Santa Rally in 2023?
July 2024 - Once the 2023 Christmas New
Year period had passed with the index falling in very
early January, the index then rallied about 6 per cent
through February and into March, then stalled for a few
months.
6 January 2024 - The official Santa
Rally* period has now ended and the index was flat - from
the close of trade on 20 December (see the updated first
chart at right), the index fell into day "1" of the
period, then rallied 1.8 per cent over days 2, 3, 4, 5 and
then the first day of the New Year; but then fell heavily
on the the final day of the official period. In the second
chart at right we can see the nice extended Christmas
rally over 9 weeks from late October to be up 11.6 per
cent before falling in the first week of January (the
black candle).
30 December 2023 - We are part way through the
official Santa Rally period, and the index is higher.
Also, the middle chart is updated to show the now 9-week
rally.
23 December 2023 - How will the official
Santa Rally period pan out this year? The first chart at
right will firstly be the snap shot on 30th December (not
there yet). In the lead up to the official Santa Rally
period, the index has rallied nicely - by 10 per cent. The
middle chart at right shows this - the XAO index on a
weekly candle chart with the index rallying for 8 weeks
from late October.
|
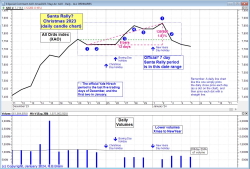
The Yale Hirsch rally?
7 days (daily chart)
The index was flat over the official
Santa Rally period.
The index was up 1.81 per cent.
|
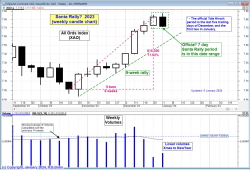
September 2023 - early January 2024
(weekly candle chart)
The index rallied 11.6 per cent over the
9 weeks leading up to Christmas,
then fell in the first week of January.
|

Sept 2023 - June 2024
(weekly candle chart)
After the 2023 Christmas period.
|
2022
Santa Rally in 2022
July 2023 - The third chart at right shows
what happened after the Christmas period finished. The
index rallied for 5 weeks, and then was range bound for
months.
21 January 2023 - The first two
charts at right have been updated. The Santa Rally did not
transpire, as explained on 7 January below. The second
chart clearly shows the 9-week rally before Christmas,
then a 4-week downtrend (retracement) leading into the
official Santa Rally period, then a nice rally after
Christmas - for at least 3 weeks.
7 January 2023 - The first chart at right has
been updated to show the key seven days of the Yale Hirsch
Santa period. Over these 7 trading days, the All Ords
(XAO) index lost 0.6 per cent - no Santa Rally this
Christmas.
30 December 2022 - How will the official
Santa Rally period pan out this year? The first chart at
right is the snap shot on 30th December. In the official
Santa Rally period, the index has fallen. We have two more
trading days to watch for. The second chart at right shows
the XAO index on a weekly candle chart with the index
rallying for 9 weeks from 3 October to late November.
|
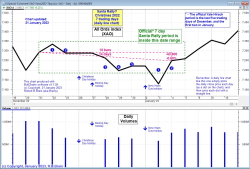
The Yale Hirsch rally?
7 days (daily chart)
The index fell 0.6 per cent.
|
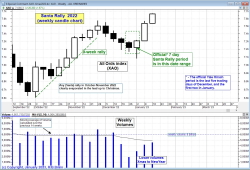
September - 30 December 2022
(weekly candle chart)
|
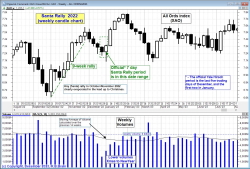
August 2022 - July 2023
(weekly candle chart)
After the 2022 Christmas period,
we saw a 5-week rally, then nothing.
|
2021
Santa Rally in 2021
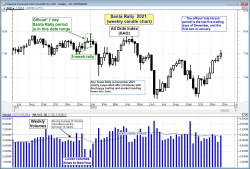
8 January 2022 - The first chart at right is
now updated to show that the index rallied about 2.8 per
cent over the official Santa Rally period, which ended the
day before the index fell heavily - back to where it was a
few days prior.
The second chart at right now shows that the index traded
in a range for the lead up to December, then there was a
5-week rally leading into the Christmas period.
1 January 2022 - The first chart at right has
been updated to show the latest market performance. Note
that there has been a rally in recent days, and that a
Santa Rally might indeed be under way. But we need to wait
and see the market performance on the next two trading
days.
25 December 2021 - How will the official
Santa Rally period pan out this year? The first chart at
right is the snap shot on Christmas Day (25 December),
with the index rallying over the first two days of the
period.
|
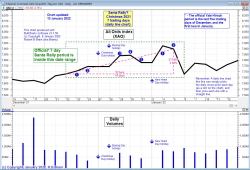
The Yale Hirsch rally?
7 days (daily chart)
The index was up 2.8 per cent.
|
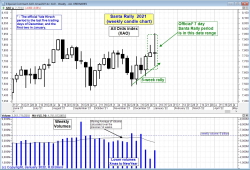
June 2021 - early January 2022
(weekly candle chart)
The index traded in a range in
the period from July to December 2021,
then rallied for about 5 weeks over
the Christmas New Year period.
|
July 2021 - November 2022
(weekly candle chart)
After the 2021 Christmas period,
the 5-week market rally
failed to continue.
|
2020
Santa Rally in 2020
9 January 2021 - Over the strict Yale-Hirsch
period the Australian market rallied 1.6 per cent, even
though the trading was within the confined congestion
range that was in place for all of December. The first
chart at right shows the daily moves of the index in this
period. Also, the American S&P500 index was up 1 per
cent, noting that they did not have a holiday break on our
Boxing Day Monday, so there 7-day count started one day
later than ours.
2 January 2021 - At this stage we are
part way through the official Yale-Hirsch Santa Rally
period, and there is no true "Santa Rally" apparent on the
Australian market - but there are still two trading days
to go.
2 January 2021 - The middle chart at
right shows the lead up to the 2020 Christmas season. The
market fell off a cliff in late February and March 2020
due to the global coronavirus pandemic. Then our market
rallied some 40 per cent over the following 40 weeks.
|
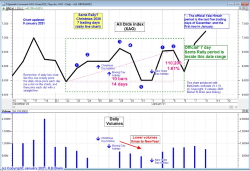
The Yale Hirsch rally?
7 days (daily chart)
The Aussie index was up 1.6 per cent
for these 7 trading days.
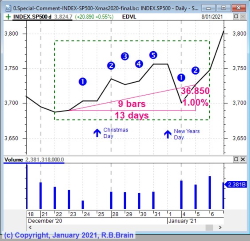
The S&P500 index
was up 1 per cent over
over the official Yale-Hirsch
7-day Santa Rally period.
|
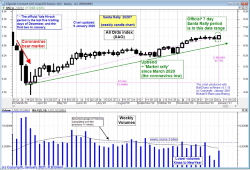
March 2020 - early January 2021
(weekly candle chart)
The index was up 45 per cent
from the March 2020 (coronavirus) lows
until 8th January 2021.
|
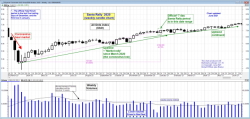
March 2020 - June 2021
(weekly candle chart)
After the 2020 Christmas period,
the market rally continued for at
least several weeks.
|
2019
Santa Rally in 2019
11 January 2020 - Well, perhaps there was
no official Yale-Hirsch Santa rally on the local Aussie
market at the end of 2019, but the push to new all-time
record highs on 10th and 11th January indicate that an
uptrend from August is continuing (see the middle chart at
right), and some people might refer to this longer term
rally as a Christmas Rally, or Santa Rally. So perhaps we
can say that we have had one.
4 January 2020 - Well, the official
window for the Yale-Hirsch Santa Rally has now passed and
there was a fall in our local market over the 7-day period
- so no Santa Rally (see the first chart at right).
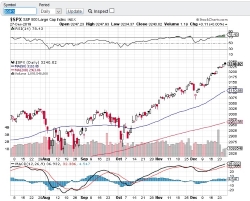
However, the next chart at right shows the S&P500
index over the same period and a rise of 0.34 per cent -
so the Yale-Hirsch Santa Rally did occur on the US market.
28 December - The chart "July-November
2019" at right is updated this week, in anticipation of
the market performance next week. Whatever happens, we can
see that the local market index has actually been rallying
(on this weekly chart) since the lows of 12th August.
Also, the chart at far right is the S&P500 index on
the US market which shows a strong rally since early
October - which some people might call a "Santa Rally"
because the market is rallying at around Christmas time.
20 December - Nothing has changed since
the last update on 14 December below.
14 December - In some years a pseudo
Santa Rally is under way by now. A year ago, the market
was crashing in December. And so far this year there is
not much to report at this time.
30 November 2019 - Will we see a Santa
Rally in 2019? Given that the index has performed so well
lately (up 7 per cent since early August 2019).
|
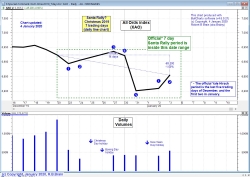
The Yale Hirsch rally?
7 days (daily chart)
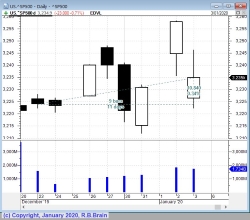
The S&P500 index
over the official Yale-Hirsch
7-day Santa Rally period
|
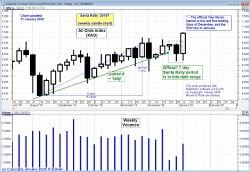
July 2019 - early January 2020
(weekly candle chart)
|
S&P500 (US) index
28 Dec 2019 - Long-running American bull market
|
2018
Santa Rally in 2018!!
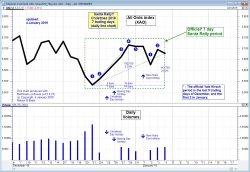
4 January 2019 - Well, the official Santa
Rally period has finished, and we have seen a Santa Rally
on the Australian market. The first chart at right shows
that even though we had a maximum increase of 3.3 per cent
during the period, the actual market increase over the
official 7 days was 2.6 per cent. Now, for anyone who
considers that a Santa rally could be valid over a longer
time period at this time of year can go hunting for it -
there are still a few possible days left.
29 December 2018 - Well now, who would
have thought that? With our market falling heavily in
recent weeks, the index has just rallied 3 per cent in the
latest week, and this qualifies for the title of Santa
Rally. But the precise definition for a Santa Rally covers
a 7-day trading period which has three more days to go. So
let's watch and see...
22 December 2018 - The first chart at
right shows that the official Yale Hirsch Santa Rally
period has now started - on Friday 21st - with the index
falling 0.7 per cent. The chart at far right has been
updated to include the latest week.
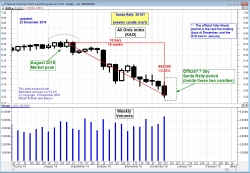
15 December 2018 - The candle chart at
far right shows the performance of the XAO index since
June 2018 - a market peak in August, then an 11 percent
fall into a market correction by mid-December.
|
The Yale Hirsch rally?
7 days (daily chart)
|
August 2018 - August 2019
(weekly candlestick chart)
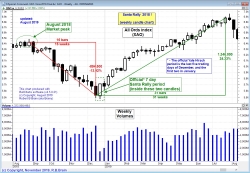
This chart shows the strong downtrend through August to
December 2018
into Christmas Eve,
followed by a strong multi-month
uptrend of 24 per cent
to new highs in July 2019.
The official Yale-Hirsch Santa Rally is one thing, but the
subsequent uptrend is something else again. |
June - Dec 2018
(weekly candlestick chart)
This updated weekly candle chart
shows the market peak in August
and the fall of 14 percent into a
market correction before Christmas.
|
2017
Will we see a Santa
Rally in 2017?
22 December 2017 - Somewhat similar to one year
ago, the Australian index already showed a rally in a
period prior to the Christmas season - in this case from
early October (second chart at right). Some commentators
have referred to this as a Santa Rally.
30 December 2017 -
With three trading days in the latest week, and two more
days to come in the official Santa Rally period, the
Australian market index has been mostly sideways in recent
days.
6 January 2018 -
Throughout the official 7-day period, we did not see a
rally on the Australian market. However, on the very next
day the index was up 0.7 percent, and a decent rally is
indicated (you can just see the last point on the first
chart at right).
|
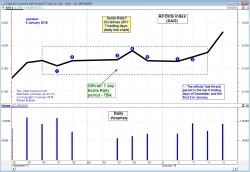
The Yale Hirsch rally?
7 days (daily chart)
|
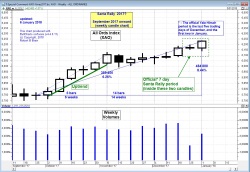
October 2017 - onwards
(weekly candlestick chart)
(to 6 January 2018)
This chart shows an uptrend in place
from early October 2017, with an
increase of 6.3 percent in
the initial uptrend until early November,
and then a further 1 percent increase.
Then another rise in early January outside the official
Santa rally period, taking the uptrend from early October
to 8.44 percent over 14 weeks. |
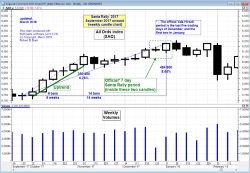
Sept 2017 - Feb 2018
(weekly candlestick chart)
This daily candle chart
(from September 2017 to
early February 2018)
is very similar to the one at left,
and it shows what happened after
the official Santa Rally period - there was a fall in the
market, effectively terminating
any uptrend and rally that
might have been in place.
|
2016
Did we see a Santa
Rally in 2016?
17 December 2016: The Australian index already
showed a rally from early November. Some commentators
referred to this as a Santa Rally.
5 January 2017:
The Aussie index rallied 1.7 percent during the official
Santa Rally Period.
20 January 2017: A
Santa Rally occurred (according to the strict Yale Hirsch
definition), and for anyone in the market prior to this,
the index rallied somewhat further. And the rally
continued even further until the second week of January.
(The index actually rose 11.8 percent from trough to peak
on the daily chart - November to early January).
21 April 2017:
From early January, the index continued higher (see third
chart at right).
|
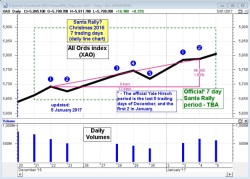
The Yale Hirsch rally?
7 days (daily chart)
A good market rally in the lead up to the official 7-day
period; but what about the official 7 days? (see the chart
above)
|
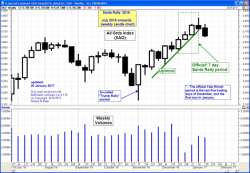
July 2016 - onwards
(weekly candlestick chart)
(updated 23 December 2016)
This chart shows an uptrend in place from the time of
the US Presidential election (early November). Many
commentators have already called this a Santa Rally. |
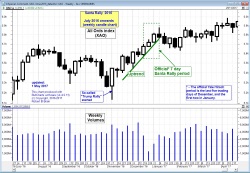
2016 - 2017
(daily candlestick chart)
A weekly candle chart from July 2016 to April 2017,
showing that after the uptrend marked on the previous
chart (at left), and also after the official 7-day Santa
Rally period, the index continued to trend higher, albeit
at a slower pace than from November to early January.
|
2015
Did we see a Santa Rally
in 2015?
The Australian market certainly rallied for a
period of time in December 2015.
The index rallied 8.1 percent of 9 consecutive trading
days, commencing on 15 December. We could call this a
Christmas Rally, or even a Santa
Rally using the loose definition of the term.
Update: February 2016.
Referring to the middle chart at right, note the bigger
downtrend in place prior, and persisting after, the Santa
Rally.
|
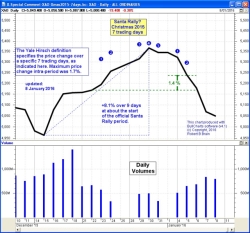
The Yale Hirsch rally?
7 days (daily chart)
A 1.4 percent increase over this 7-day period.
|
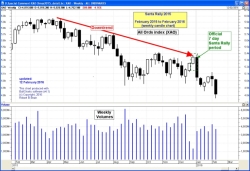
February 2015 - February
2016
(weekly candlestick chart)
This chart shows that after hitting a resistance
level below 6000 points in March-April 2015, the index
trended
lower (a confirmed downtrend of
lower peaks and troughs).
We can now see clearly that the apparent Santa Rally in
late December was merely a short term rally (retracement)
within the bigger down trend. |
 (relevant chart
pending) (relevant chart
pending)
2015 - 2016
(daily candlestick chart)
A daily candle chart from mid-October 2015 showing a
downtrend through November to a market low on 15 December.
Along the way, there was a 5.2 percent rally in
mid-November (retracement of the down trend).
|
2014
Did we see a Santa Rally
in 2014?
The chart in the middle at right is a weekly from
October 2013 and shows how weekly volumes fall off in the
Christmas New Year period. On this chart we can see in
August 2014 the index topped, then fell heavily into
September, then rallied for a couple of weeks but failed
to reach the August highs, then fell heavily in early
December. At this point most people had given up hope of a
Santa Rally.
Update: 17 January 2015.
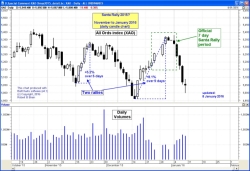
The first chart at right shows that there was no Santa
rally (according to the Yale Hirsch definition), while the
second chart shows a 4 percent rally over 4 weeks from
mid-December to mid-January, followed by a sharp fall (of
3 percent in the latest week).
Update: March 2015.
The third chart at right is a daily candlestick chart from
November 2014 to February 2015. It clearly shows that a
meaningful rally started on 21st January 2015, and the
index rose with 10 consecutive white candles (the close
price above the open price), with the index rising 10
percent over the 4 week period.
|
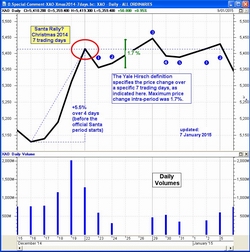
The Yale Hirsch rally?
7 days (daily chart)
After the seventh day of this period, the index
is about where it started several days earlier. As
per this definition of the Santa
Rally, there was none. The chart here shows a
maximum range in index value of 1.7 percent over the seven
days (but this doesn't count). |
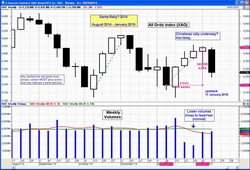
September 2014 - January
2015
(weekly candlestick chart)
This chart shows the index movements from a peak in
mid-August, to a trough in early October, then a lower
peak in early November, and another trough in early
December. From this low, the index rallied 4.68 percent
over four weeks until 9th January, then fell 3 percent. In
the broader definition of a Santa
Rally, it might be possible to argue that we have
seen a rally, albeit a short one. |
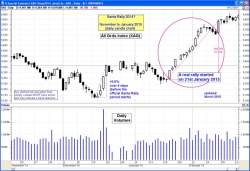
November 2014 - February
2015
(daily candlestick chart)
A more meaningful rally started on
21 January, with the index rising 10 percent over 4 weeks.
You could hardly call this a Santa
Rally, but for anyone watching the market, a
successful investment could have been possible.
|
2013
A
so-called Santa Rally was evident this year.
Firstly, as defined by Hirsch (see
above), we saw a 1.7 percent increase over these 7
trading days of the season (see the first chart at
right). If we accept a looser definition, then we can see
a short rally was underway through late December (see the
other two charts).
The second chart also shows a regular rally from June to
November 2013 (11 percent increase), which was then
followed by a short retracement in late September, then
another short (4 week) rally until a top at about 5400 in
late October.
|
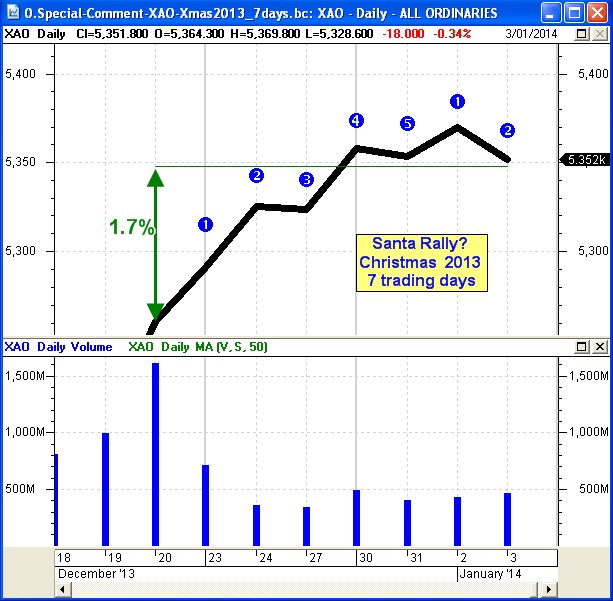
The Yale Hirsch rally?
7 days (daily chart) |
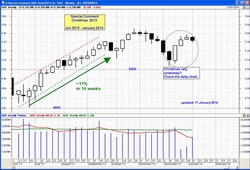
June 2013 - February 2014
(weekly chart) |
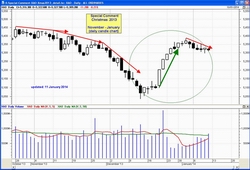
Detail
November 2013 - January 2014
(daily chart) |
2012
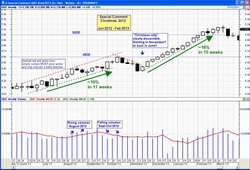
A Santa Rally was evident in 2012, with the index trending
strongly higher.
The second chart at right clearly shows two rallies in
late 2012. A prolonged rally that started in June,
until a high in mid-October and a 4-week retracement.
Then a 15 week rally with only one black candle, and
a rise of about 16 percent over the 15 weeks. This rally
started in mid-November and topped out in early March
2013.
|
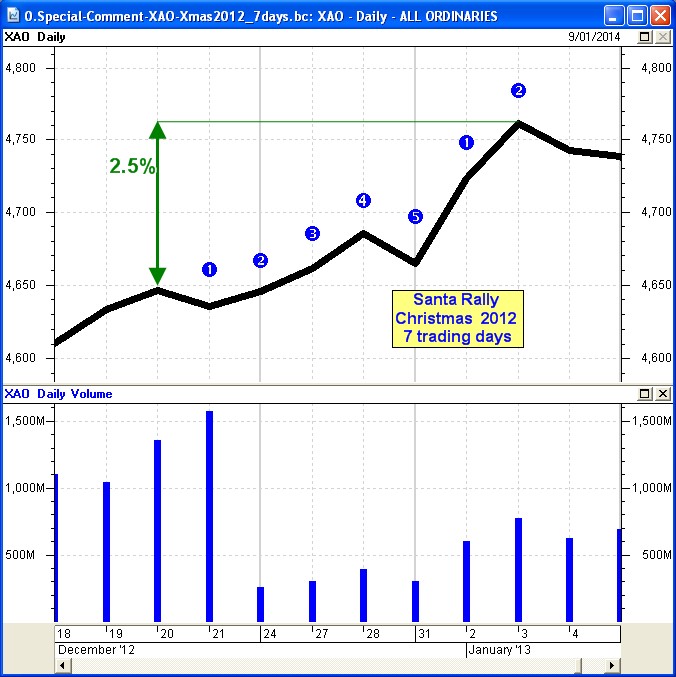
The Yale Hirsch rally?
7 days (daily chart) |
June 2012 - March 2013
(weekly chart) |
(no
chart
here) |
2011
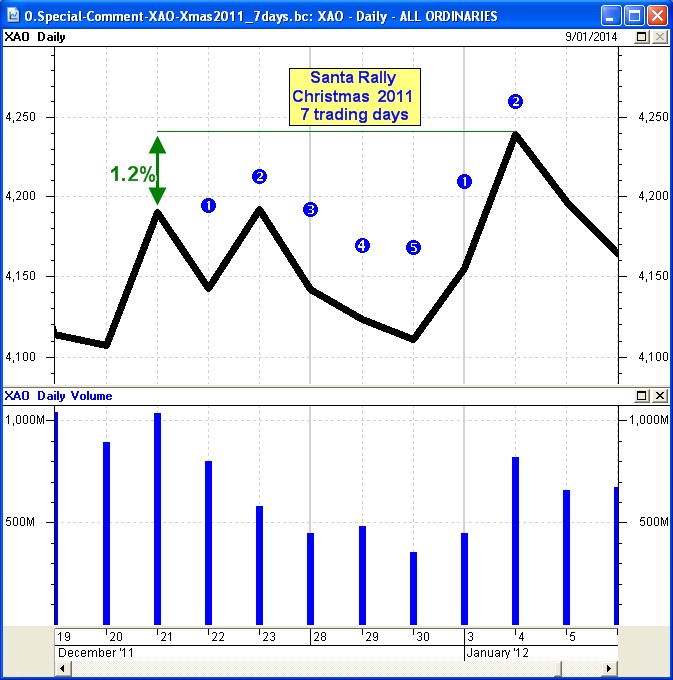
The first chart at right shows how the index moved over
the Hirsch 7-day trading period - initially trending
lower, before a sharp 2-day rally to result in a Santa
Rally being completed. Actually, if it wasn't for the
sharp move higher on January 4th, the Santa Rally would
not have confirmed.
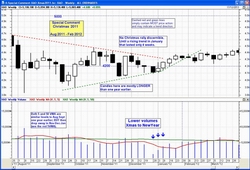
The second chart at right shows the bigger picture and a
Symmetrical Triangle chart pattern in the period August to
December 2011 - indicated by the two dotted lines which
contain the price action and tend to converge (this
pattern indicates progressively more agreement on price
between buyers and sellers).
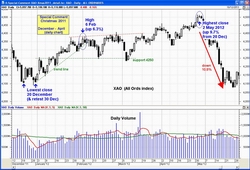
The third chart shows a general rally over the four week
period in early to mid-January, and clearly shows a trend
line under the rising price action from a low on 20
December (which was re-tested on 30 December). [This trend
line is drawn under the daily lows to capture all traded
values.] The price action first breaks down across this
uptrend line on 2nd February to indicate a weakening of
the trend, then closes below the trend line on the 10th.
The maximum rise in this period was 6.3 percent. During
February and early March the index fell to test the 4250
support level on two occasions, then rallied again to
higher highs in early May, after which it fell more than
10 percent (a correction). |
The Yale Hirsch rally?
7 days (daily chart) |
August 2011 - March 2012
(weekly chart) |
Detail - December 2011 -
April 2012
(daily chart) |
2010
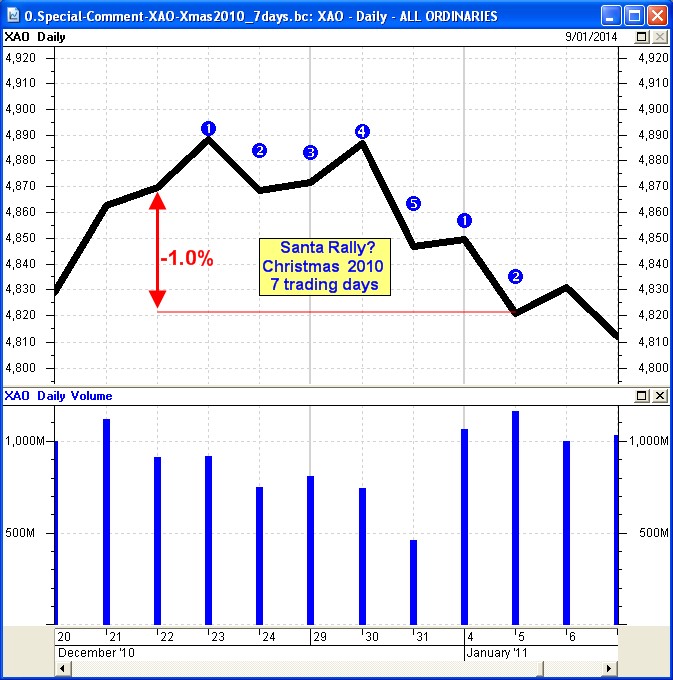
The first chart at right is the Hirsch 7-day Santa Rally
period, showing a decline over these 7 days - no Santa
Rally.
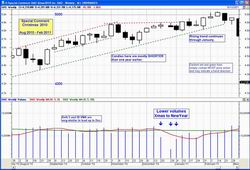
This volatility over the Christmas period is not all that
obvious in the second chart at right (a weekly chart); but
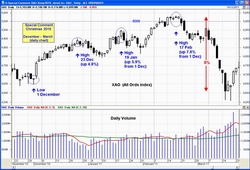
the third chart (a daily) clearly shows the highs (and
lows) within each week (the daily extremes of price).
From a low on 1st December, the index rallied 4.8 percent
to a high on 23 December, then fell away on falling
volumes to sit above 4800 through the first week of
January. The index then rallied again to another high on
19 January, then fell away over a 2 week period, then
rallied strongly yet again to a high on 17 February (well
after the Christmas period). After this high, the index
fell 8 percent to be lower than it's starting point on 1st
December.
|
The Yale Hirsch rally?
7 days (daily chart) |
August 2010
- February 2011
(weekly chart) |
Detail - December 2010 -
March 2011
(daily chart) |
2009
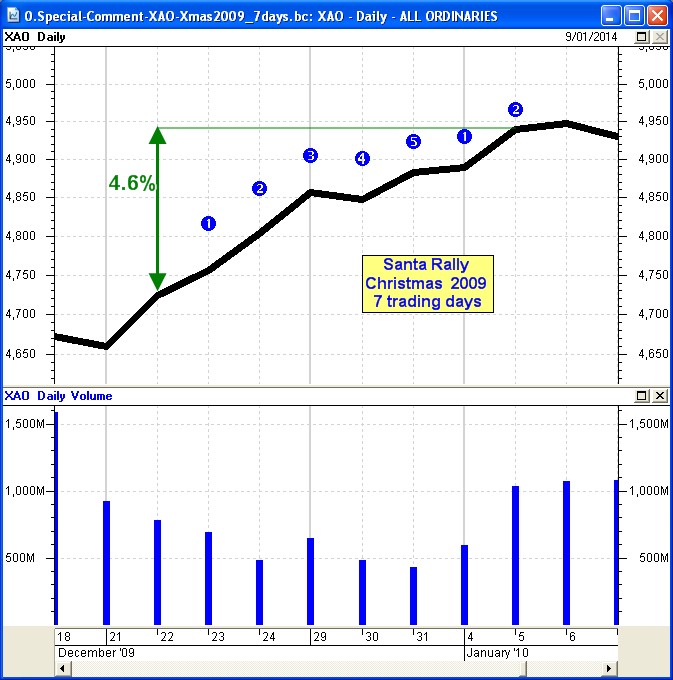
The first chart at right clearly shows the Hirsch Santa
Rally with higher closing prices almost every day over the
7 day period.
In the bigger picture (second chart at right) we can also
see that a broader rally took place from August 2009 to
early October - well before the Christmas period. Followed
by lower peaks through October and November but sitting
above support at about 4600.
In the third chart at right (a daily) we can see that an
uptrend started on 10th December with a peak on 11 January
- a 7.7 percent increase over 32 days (19 candles). This
included a sequence of 7 strong white candles out of 8
from 22 December until 5 January. And on much lower
volumes.
So much for investors and traders taking holidays over the
Christmas New Year holiday period. But note the sell-off
that followed in late January. |
The Yale Hirsch rally?
7 days (daily chart) |
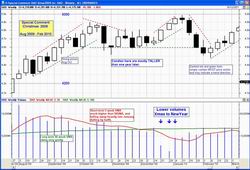
August 2009 - February
2010
(weekly chart - every candle summarises
the price action for one week) |
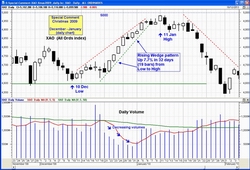
Detail - December 2009 -
Jan 2010
(daily chart - every candle summarises
the price action for one day) |
2008
The first chart at right clearly shows the Hirsch Santa
Rally over that 7 day period.
However, in the bigger picture chart (the second one at
right - a weekly chart) we can see a downtrend in place in
the last few months of 2008 (about the time of the Lehmann
Brothers issues). So, even though a down trend existed, a
Santa Rally (a relief rally) still took place during this
Christmas period.
|
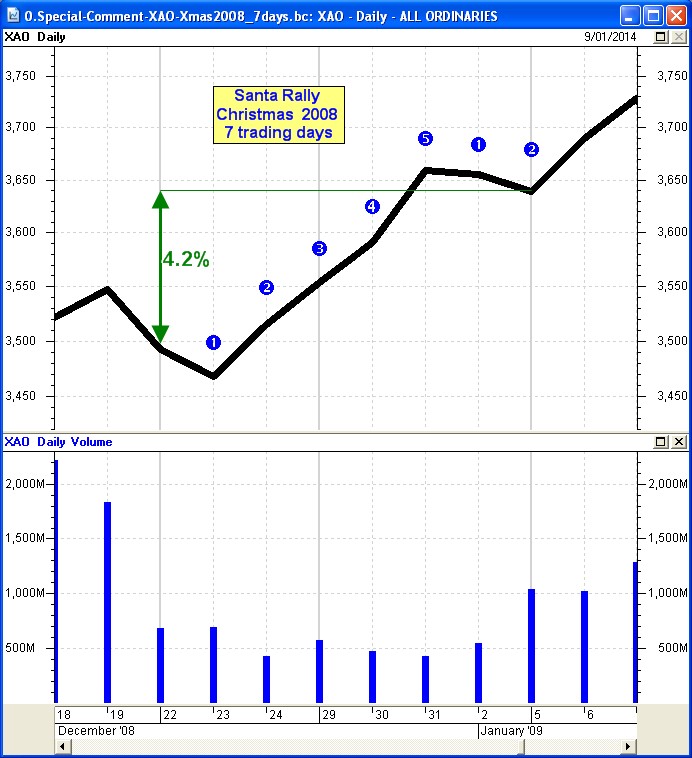
The Yale Hirsch rally?
7 days (daily chart) |
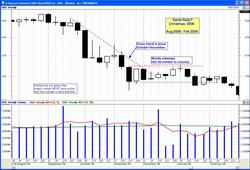
August 2008 - February
2009
(weekly chart - every candle summarises
the price action for one week) |
(no
chart
here) |


