Technical Analysis

 |
Technical Analysis |
|
| Price
charts
summarise the underlying opinions and emotions of the
real market participants. Every chart tells a story. It pays to understand the stories in the price charts. |
| You are here: Share Market
Toolbox > Technical Analysis Related links: Technical Analysis - Getting Started; Technical Analysis - What is it?; Chart patterns; Technical analysis (chart) indicators; TA - The Proof; 4 Windows approach Practical applications and more about Technical Analysis; Published ATAA articles; Beware the falling stocks; Blue Chips; Dow Theory; Price Action Context; Moving Average; Weinstein's 30-week MA; Trends and trend-spotting; Support and Resistance; Breakouts; Candlestick charts; Divergence; semi-log price charts; Exit strategies; Stop Loss; Fundamental analysis; Funda-Technical Analysis; eBook Articles Master List; eBook Articles INDEX; about the eBook Articles; |
Technical
Analysis - what on earth is it?
|
||||||||||||
Seem too hard? or confusing?In case you are already aware of technical analysis, and perhaps it seems to be a little difficult or confusing, make sure to see the Simple and Practical Applications web page. |
|
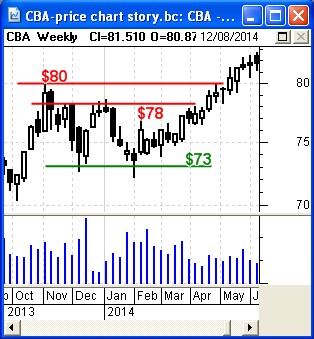
Don't believe it?Perhaps you are somewhat sceptical about the idea that there are stories in the price charts that are left behind by the market participants? Look at the chart at right and consider the following observations (click on the chart for a larger version with more details and comments). In this price chart, we can see that in late 2013 there were no buyers of CBA shares who thought the stock was worth more than $80. When the price rose this high in October 2013, sellers stepped in to take profits. [ie. the opinion of market participants was that CBA was not worth $80.] The $80 level was a resistance level. This caused the price to fall away, but trade mostly higher than about $73. So the $73 price level was a floor (or support level) for the price. And for the next few months it traded no higher than $78. [ie. the opinion of market participants was that CBA was worth between $73 and $78 - no lower and no higher.] This was the case until April 2014 when buyers started falling over each other to buy the stock. This caused the price to push above the $80 level, and keep rising in a strong uptrend. [ie. the opinion of market participants was that CBA was now worth more than $80.] |
 Weekly price chart of CBA from October 2013 to May 2014. (Click on the chart for a larger view with more details and comments) The opinion of market participants is captured in the price charts. |
Brief Introduction VideoWatch a 6-minute "Very brief Introduction to Technical Analysis" video on YouTube:NOTE: You can also see the full 60-minute version of this video - see the link below. . |
|
Not
convinced? See some supporting materials
that provide evidence.
It is the underlying emotions of fear, greed and hope which drive share prices, often based on fundamental data or news stories. And all of these are reflected in the share price charts. The underlying sentiment is reflected in the price charts, and in the volume bars on the chart, and in the relative height of candlesticks on a candle chart, and the presence and length of tails on the individual candlesticks. And successive days or weeks of price movement can form patterns on the chart which also reflect the underlying market sentiment.
"The
interpretation of past share prices and volume
(typically on share price charts)
to try to gauge likely future price action."
The field of Technical Analysis is the study and interpretation of the price action of financial instruments (eg. shares, currencies, commodities, bonds, etc.) and the “statistical prediction” of their future behaviour. In Technical Analysis there is a substantial body of knowledge ranging from simple price charts to complex mathematical and computer studies.
| For some
tips and guidance to help you get started with utilising technical analysis, see
Robert's 4 Windows approach which provides a great check list, as well as an introduction to a number of key aspects of technical analysis. |
 |
Firstly, it is worth re-stating that the price charts summarise the opinions of the market participants regarding so-called fair value for the share price. The price charts can tell us a story about what “Mister Market” is thinking. It pays to understand the stories in the price charts - this is technical analysis. The more insight we can gain into the share price history, the more we can understand the opinions of the market participants, and the underlying balance of supply and demand for the shares. And this can help give us greater confidence about the more likely scenarios for future price movements. Don’t forget that we are not trying to predict future share prices. We are trying to anticipate the likely future movements so that when a move happens we won’t be surprised by the move.
In it's purest form, the application of technical analysis can involve no consideration of Fundamental Analysis; but the two approaches can be combined - eg. in the Funda-Technical Analysis approach.
People who use technical analysis might invest in shares in the share market, or in currencies (forex), or options, warrants, commodities or other sorts of financial instruments. Thousands of people around the world use this to successfully time the market. Nothing is 100% perfect, but when coupled with the right approach, strategy and money management and risk management methods, one can be very successful and profitable.
The study of technical analysis has been around for many centuries - see History details in Wikipedia.
Okay, so how can we use the simple aspects of technical analysis to: identify potentially profitable stocks, invest wisely, manage the risk, and protect our capital against downside risks? See the details here...
To read more about the key aspects of technical analysis, see the details below.
Not convinced? See some supporting materials that provide evidence.
60-minute Introduction VideoWatch a 60-minute "Introduction to Technical Analysis" video on YouTube:. |
 The
Australian
Technical Analysts Association (ATAA) is a not-for-profit
organisation meeting at 9 locations around Australia.
 Also see Wikipedia for another view of technical analysis.
Also a range of classic text books on the subject.
Before investing money in the markets, make sure to check with a qualified financial advisor to check if your planned investment is appropriate for you.
STOP! - Are you Share Market Ready?
| Whatever you do, beware of the sharks in the ocean!  |
Key aspects of technical analysis |
||||||
|
||||||
|
Not convinced? See some supporting materials that provide evidence. |
||||||
|
||||||
|
Not convinced? See some supporting materials that provide evidence. |
||||||
|
||||||
|
Not convinced? See some supporting materials that provide evidence. |
||||||
Volume is importantIt is also very useful to understand that the volume traded each day and week is very important. Observing the volume in each scenario above will provide a greater insight to the majority view of the market participants.Time periods - daily weekly, etc.All of the above observations of the share price (and volume) behaviour can be performed on daily price charts, or weekly charts, or monthly charts, or quarterly or yearly charts. They can also be done on various intraday time periods (1-minute, 2-minute, 5-minutes, 10-minutes, half hour, hourly, 2-hourly).The daily line chart, for example, shows the close price at the end of each day - all joined together with short straight line segments. Likewise, the weekly line chart shows the close price each week joined together with straight lines. And so on for the other periods. Dow TheoryThe term Dow Theory refers to a body of knowledge which underpins key aspects of contemporary technical analysis. There are six tenets of Dow Theory, and it is very useful to understand each of them. Read more about Dow Theory. |
||||||
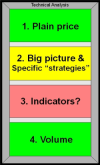
Chart indicatorsThe above key aspects of technical analysis provide insights into the underlying opinions of the market participants by studying only the plain price action, and the volume. The broad subject of technical analysis also includes the use of chart indicators which are derived from the price action. There are many technical analysis indicators.
|
||||||
Price Action ContextThis is another aspect to the study of the price charts, and one which is not mentioned very much. You can read more about Price Action Context here in the Toolbox. |
||||||
How can we use simple technical analysis to be profitable?Okay, so how can we use the simple aspects of technical analysis to: identify potentially profitable stocks, invest wisely, manage the risk, and protect our capital against downside risks? See the details here... |
||||||
In summaryThe study of technical analysis provides invaluable insights into the underlying mood and sentiment of the security or the market. It can be applied to price charts of stocks, and the market index, and commodities, and other financial instruments. Price
charts summarise the underlying opinions The above samples are merely a small collection of samples - there is much more to this field of study. And if you have trouble with the charts, some people study technical analysis without using price charts at all - the branch of study referred to as numerical analysis, or computational analysis. There are a number of basic strategies that some people consider implementing. More informationTechnical Analysis - What is it? (more details)... Technical Analysis - Some simple and useful applications Technical Analysis - how to get started... Also see the links in the column at top right. |